
Homework Answers

Add Answer to:
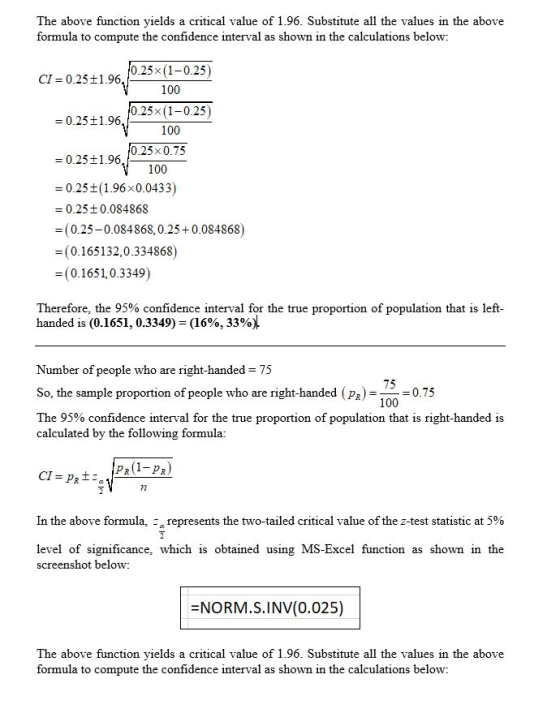
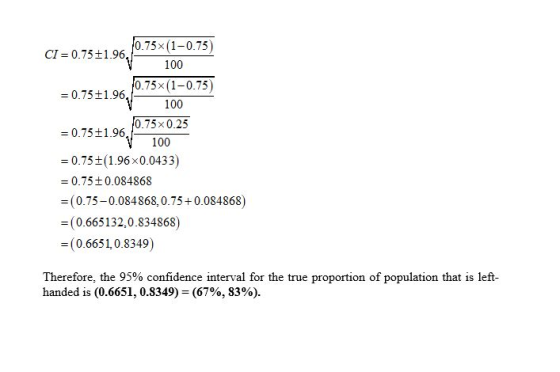
The table below shows which hand is favored by each person from a sample of 100...
We will be using Excel to simulate the number of left-handed people in a particular sample....
We will be using Excel to simulate the number of left-handed people in a particular sample. Left-handed people make up about 10% of the population. We will randomly pick numbers between 1 and 10, where 1 represents a left-handed person and 2 - 10 represents a right-handed person. This should result in about 10% of our sample being left-handed. Please note there are five parts to this question. 1. Create a pie graph in Excel to show the proportion of...
If a person is selected at random, find the probability of each event Male Female Total...
If a person is selected at random, find the probability of each event Male Female Total Left 63 50 113 Right 462 425 887 Total 525 475 1000 a)Find the probability of being left handed. b)Find the probability of being right handed given that you are female.
The contingency table below shows marital status for 100 randomly selected adults by gender. Find the...
The contingency table below shows marital status for 100 randomly selected adults by gender. Find the probability that a randomly selected adult is married, given that the person is female, and then find the probability that a randomly selected adult is female, given that the person is married Married Unmarried Total Male 14 26 40 Female 41 19 60 Total 55 45 100
If a person from your data set is randomly selected, find the probability that they are...
 If a person from your data set
is randomly selected, find the probability that they are
left-handed or male.
L=ledt, R=Right, 1=Female, 2=male
Tabulated Statistics: gender, handedness Rows: gender Colums: handedness L R Missing All 2 Missing 18 248 15 114 2 0 266 1 12에
If a person from your data set
is randomly selected, find the probability that they are
left-handed or male.
L=ledt, R=Right, 1=Female, 2=male
Tabulated Statistics: gender, handedness Rows: gender Colums: handedness L R Missing All 2 Missing 18 248 15 114 2 0 266 1 12에
In a poll of 175 randomly selected U.S. adults, 94 said they favored a new proposition....
 In a poll of 175 randomly selected U.S. adults, 94 said they favored a new proposition. Based on this poll, compute a 95% confidence interval for the proportion of all U.S. adults in favor of the proposition (at the time of the poll). Then complete the table below Carry your intermediate computations to at least three decimal places. Round your answers to two decimal places. (If necessary, consult a list of formulas.) What is the lower limit of the 95%...
John has obtained two independent samples form two populations, where the sample statistics are shown in...
John has obtained two independent samples form two populations, where the sample statistics are shown in the table below. Assuming equal variances, he can construct a 95% confidence interval for the difference of the population means to be Sample 1 Sample 2 Mean 22.7 20.5 Variances (s^2) 5.4 3.6 Observations (sample size) 9 9 [0.08, 4.32] [1.17,5.08] [2.44,6.19] [-0.09,3.19] True or False? A new policy of “flex hours” is proposed. Random Sampling showed that 40 of 50 female workers favored...
Question Help - Use the sample data and confidence level given below to complete parts (a)...
 Question Help - Use the sample data and confidence level given below to complete parts (a) through (d) In a study of cell phone use and brain hemispheric dominance, an Internet survey was e-mailed to 2376 subjects randomly selected from an online group involved with ears. 955 surveys were returned. Construct a 95% confidence interval for the proportion of returned surveys Click the icon to view a table of z scores a) Find the best point estimate of the population...
Use the sample data and confidence level given below to complete parts (a) through (d). In...
 Use the sample data and confidence level given below to complete parts (a) through (d). In a study of cell phone use and brain hemispheric dominance, an Internet survey was e-mailed to 2424 subjects randomly selected from an online group involved with ears, 1154 surveys were returned. Construct a 95% confidence interval for the proportion of returned surveys. Cick the icon to view a table of z scores a) Find the best point estimate of the population proportion p. (Round...
For each of the following research questions, specify the parameter and the value that constitute the...
For each of the following research questions, specify the parameter and the value that constitute the null hypothesis of "parameter = null value." In other words, define the population parameter of interest and specify the null value that is being tested. a) Do a majority of Americans between the ages of 18 and 30 think that the use of marijuana should be legalized? The proportion of adult Americans between the ages of 21 and 32 who think the use of...
In a sample of 68 randomly selected students, 29 favored the amount being budgeted for next...
In a sample of 68 randomly selected students, 29 favored the amount being budgeted for next year's intramural and interscholastic sports. Construct a 95% confidence interval for the proportion of all students who support the proposed budget amount. (Give your answers correct to three decimal places.) Lower Limit ____ Upper Limit ____
 If a person from your data set
is randomly selected, find the probability that they are
left-handed or male.
L=ledt, R=Right, 1=Female, 2=male
Tabulated Statistics: gender, handedness Rows: gender Colums: handedness L R Missing All 2 Missing 18 248 15 114 2 0 266 1 12에
If a person from your data set
is randomly selected, find the probability that they are
left-handed or male.
L=ledt, R=Right, 1=Female, 2=male
Tabulated Statistics: gender, handedness Rows: gender Colums: handedness L R Missing All 2 Missing 18 248 15 114 2 0 266 1 12에
 In a poll of 175 randomly selected U.S. adults, 94 said they favored a new proposition. Based on this poll, compute a 95% confidence interval for the proportion of all U.S. adults in favor of the proposition (at the time of the poll). Then complete the table below Carry your intermediate computations to at least three decimal places. Round your answers to two decimal places. (If necessary, consult a list of formulas.) What is the lower limit of the 95%...
 Question Help - Use the sample data and confidence level given below to complete parts (a) through (d) In a study of cell phone use and brain hemispheric dominance, an Internet survey was e-mailed to 2376 subjects randomly selected from an online group involved with ears. 955 surveys were returned. Construct a 95% confidence interval for the proportion of returned surveys Click the icon to view a table of z scores a) Find the best point estimate of the population...
 Use the sample data and confidence level given below to complete parts (a) through (d). In a study of cell phone use and brain hemispheric dominance, an Internet survey was e-mailed to 2424 subjects randomly selected from an online group involved with ears, 1154 surveys were returned. Construct a 95% confidence interval for the proportion of returned surveys. Cick the icon to view a table of z scores a) Find the best point estimate of the population proportion p. (Round...
Most questions answered within 3 hours.
-
Two small plastic spheres are given positive electrical charges.
When they are a distance of 15.4...
asked 48 minutes ago -
how
does gravity affect the trajectory of projectile? what would be the
shape of the trajactory...
asked 40 minutes ago -
An acidic solution containing gold ions is
electrolyzed, producing gaseous oxygen (from water) at the anode...
asked 1 hour ago -
Assume that the population of Mexico is 128
million and that the population increases 1.01
percentannually....
asked 2 hours ago -
Can someone please help me add appropriate descriptive
comments to each line of code in the...
asked 2 hours ago -
Romeo wishes to throw a bouquet of flowers to Juliet, who is on
a second-story balcony,...
asked 3 hours ago -
Why is QE a controversial monetary policy tool.
A. It may lead to excessive inflation.B. By...
asked 3 hours ago -
Principles of Programming midterm study guide help!
1.)
______ Which of the following would reference the...
asked 2 hours ago -
A finite potential well has depth U0 = 2.78 eV . What is the
penetration distance...
asked 3 hours ago -
1. The bus bars of a power station are in two sections A and B
separated...
asked 3 hours ago -
Fiscal policy is the deliberate manipulation of taxes and
government spending to alter GDP, employment, inflation...
asked 4 hours ago -
evaluating an expression using only one digit and + and - as
operators ....3+5-1+7-5+8
-----------------------
stack...
asked 4 hours ago