need help with the last questions.

Homework Answers
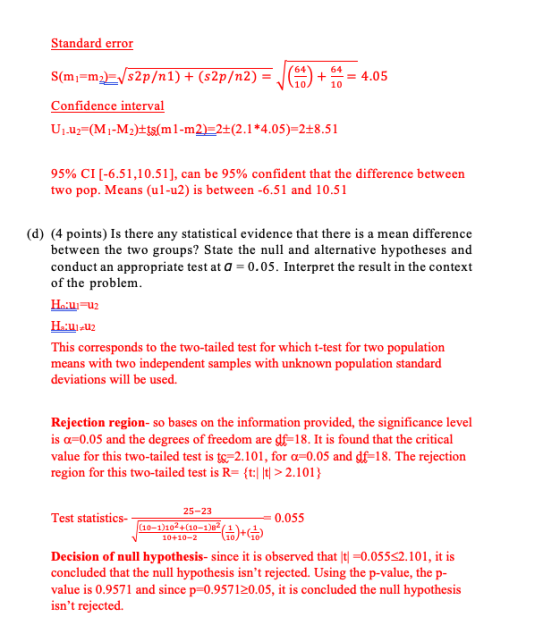
e) According to the solutions (c) and (d)
Assumptions:(i) Two populations must be independent to each other.
ii) Two populations must be normally distributed.
iii) Population variances must be unknown and equal.
f) ES= 3/9= 1/3= 0.33
n= (1.96+0.84/0.33)^2
n= 71.99
n=72
Add Answer to:
need help with the last questions.
Prothrombin time is a measure of the clotting ability of...
plz help with all questions 180-2100 I. Multiple-choice (Circle the letter of your answer): = 100...
 plz help with all questions
180-2100 I. Multiple-choice (Circle the letter of your answer): = 100 and (1) For a continuous random variable 1, the population mean and standard deviation are o 20 respectively. the mean jy and the standard deviation og of the sample mean for a random sample of 16 items from this population are ( 5 0.05) (A) Pa = 25, ; 20 (B) P = 100, -20 (C) = 25,0 = 5 (D) Hg = 100,...
plz help with all questions
180-2100 I. Multiple-choice (Circle the letter of your answer): = 100 and (1) For a continuous random variable 1, the population mean and standard deviation are o 20 respectively. the mean jy and the standard deviation og of the sample mean for a random sample of 16 items from this population are ( 5 0.05) (A) Pa = 25, ; 20 (B) P = 100, -20 (C) = 25,0 = 5 (D) Hg = 100,...
Statistical Inference. I Need help with the questions below: 4-You are testing for significant differences between...
Statistical Inference. I Need help with the questions below: 4-You are testing for significant differences between the mean scores of 2 groups. You set the level of significance at 0.05 if the mean differences is so large that it would occur by chance 1% of the time, would you accept or reject the null hypothesis? -Accept H0 -Rejected H0 5-When you make a prediction about the direction of mean differences between an experimental and a control group, would you use...
Use the following to answer the questions 1-5. A manufacturer of banana chips would like to...
 Use the following to answer the questions 1-5. A manufacturer of banana chips would like to know whether its bag filling machine works correctly at the 441 gram setting. Based on a 19 bag sample where the mean is 448 grams and the variance is 625, is there sufficient evidence at the 0.05 level that the bags are underfilled or overfilled? Assume the population distribution is approximately normal. 1. What are the null and alternative hypotheses? A-Ho: ? 441, Ha:...
A scientist wants to determine whether or not the height of cacti, in foet, in Africa...
 A scientist wants to determine whether or not the height of cacti, in foet, in Africa is significantly higher than the height of Mexican acti. He selects random samples from both regions and following data Africa: Mean - 12.1 Sample size - 201 Mean - 11.2 Sample size - 238 (a) Which of the following would be the correct hypothesis test procedure to determine if the height of cacti, in feet, in Africa is significantly higher than the height of...
Questions #7 refers to the following: Dr. Smith believes that exposing babies and children to classical...
 Questions #7 refers to the following: Dr. Smith believes that exposing babies and children to classical music with raise their intelligence quotient (IQ). To test this idea, he administers IQ tests to 10 children of his friends who listen to classical music on a regular basis. He then compares the results from these 10 kids to the national average, which is 100. The results are below: T-Test T N One-Sample Statistics Mean Std. Deviation 10113.5000 14.3469 Std. Error Mean 4...
CAN YOU PLEASE FIX MY LAST TWO SENTENCES WITH THIS INFORMATION? You note in your report...
CAN YOU PLEASE FIX MY LAST TWO SENTENCES WITH THIS INFORMATION? You note in your report both the t critical for a one tailed and a two tailed test. Identify whether you need to use a one tailed or a two tailed test for the test statistic and t critical. Then only compare the test statistic with that critical value. Otherwise when you mention both, it looks like you don't know which one to use. t-Test: Two-Sample Assuming Unequal Variances...
Hypothesis Testing Method A = ADKAR Framework (column A) Method B = Prosci Change Management Methodology...
Hypothesis Testing Method A = ADKAR Framework (column A) Method B = Prosci Change Management Methodology (column B) Null hypothesis is H0: Method A = Method B Research (Alternative) hypothesis is H1:Method A < Method B Sample size: 30 One-tailed test: Direction stated in the hypothesis is determine more effective (greater or less than). Level of Significance (a): .05 t-test is used because standard deviation of population is unknown, sample size is less than 30 Cutoff Sample Score (critical value)...
Part A: Inferential Statistics Data Analysis, Plan and Computation Introduction: Variables Selected: Any two variables out...
Part A: Inferential Statistics Data Analysis, Plan and Computation Introduction: Variables Selected: Any two variables out of Income, Age, Food, Meat, Bakery, Fruits. Table 1: Quantitative Variables from the given Dataset spreadsheet Selected for Analysis Variable Name Description Variable 1: Variable 2: Data Analysis: 1. Confidence Interval Analysis: For one quantitative variable, select and run the appropriate method for estimating a parameter, based on a statistic (i.e., confidence interval method) and complete the following Table 2. Table 2: Confidence Interval...
8. A random sample of 25 college males was obtained and each was asked to report...
 8. A random sample of 25 college males was obtained and each was
asked to report their actual height and what they wished as their
ideal height. A 95% confidence interval for μd= average difference
between their ideal and actual heights was 0.8" to 2.2". Based on
this interval, which one of the null hypotheses below (versus a
two-sided alternative)can be rejected?
A. H0: μd= 0.5
B. H0: μd= 1.0
C. H0: μd= 1.5
D. H0: μd= 2.0
9. The...
8. A random sample of 25 college males was obtained and each was
asked to report their actual height and what they wished as their
ideal height. A 95% confidence interval for μd= average difference
between their ideal and actual heights was 0.8" to 2.2". Based on
this interval, which one of the null hypotheses below (versus a
two-sided alternative)can be rejected?
A. H0: μd= 0.5
B. H0: μd= 1.0
C. H0: μd= 1.5
D. H0: μd= 2.0
9. The...
Economics- Probability and stats 1. Find the value of the 75th percentile of the following array:...
 Economics- Probability and stats
1. Find the value of the 75th percentile of the following array: 5,10,43,9,8,6,2,5 A) 8 B) 9 C) 9.5 D) 8.5 2. Two independent events, A and B, where the P(B) is 0.44 and the probability that A does not occur or B occurs is 0.74. What is the probability that event A occurs? A) 0.3 B) 0.54 C) 0.46 D) 0.28 3. Which of the following is FALSE? A) B) A sampling distribution is a...
Economics- Probability and stats
1. Find the value of the 75th percentile of the following array: 5,10,43,9,8,6,2,5 A) 8 B) 9 C) 9.5 D) 8.5 2. Two independent events, A and B, where the P(B) is 0.44 and the probability that A does not occur or B occurs is 0.74. What is the probability that event A occurs? A) 0.3 B) 0.54 C) 0.46 D) 0.28 3. Which of the following is FALSE? A) B) A sampling distribution is a...
 plz help with all questions
180-2100 I. Multiple-choice (Circle the letter of your answer): = 100 and (1) For a continuous random variable 1, the population mean and standard deviation are o 20 respectively. the mean jy and the standard deviation og of the sample mean for a random sample of 16 items from this population are ( 5 0.05) (A) Pa = 25, ; 20 (B) P = 100, -20 (C) = 25,0 = 5 (D) Hg = 100,...
plz help with all questions
180-2100 I. Multiple-choice (Circle the letter of your answer): = 100 and (1) For a continuous random variable 1, the population mean and standard deviation are o 20 respectively. the mean jy and the standard deviation og of the sample mean for a random sample of 16 items from this population are ( 5 0.05) (A) Pa = 25, ; 20 (B) P = 100, -20 (C) = 25,0 = 5 (D) Hg = 100,...
 Use the following to answer the questions 1-5. A manufacturer of banana chips would like to know whether its bag filling machine works correctly at the 441 gram setting. Based on a 19 bag sample where the mean is 448 grams and the variance is 625, is there sufficient evidence at the 0.05 level that the bags are underfilled or overfilled? Assume the population distribution is approximately normal. 1. What are the null and alternative hypotheses? A-Ho: ? 441, Ha:...
 A scientist wants to determine whether or not the height of cacti, in foet, in Africa is significantly higher than the height of Mexican acti. He selects random samples from both regions and following data Africa: Mean - 12.1 Sample size - 201 Mean - 11.2 Sample size - 238 (a) Which of the following would be the correct hypothesis test procedure to determine if the height of cacti, in feet, in Africa is significantly higher than the height of...
 Questions #7 refers to the following: Dr. Smith believes that exposing babies and children to classical music with raise their intelligence quotient (IQ). To test this idea, he administers IQ tests to 10 children of his friends who listen to classical music on a regular basis. He then compares the results from these 10 kids to the national average, which is 100. The results are below: T-Test T N One-Sample Statistics Mean Std. Deviation 10113.5000 14.3469 Std. Error Mean 4...
 8. A random sample of 25 college males was obtained and each was
asked to report their actual height and what they wished as their
ideal height. A 95% confidence interval for μd= average difference
between their ideal and actual heights was 0.8" to 2.2". Based on
this interval, which one of the null hypotheses below (versus a
two-sided alternative)can be rejected?
A. H0: μd= 0.5
B. H0: μd= 1.0
C. H0: μd= 1.5
D. H0: μd= 2.0
9. The...
8. A random sample of 25 college males was obtained and each was
asked to report their actual height and what they wished as their
ideal height. A 95% confidence interval for μd= average difference
between their ideal and actual heights was 0.8" to 2.2". Based on
this interval, which one of the null hypotheses below (versus a
two-sided alternative)can be rejected?
A. H0: μd= 0.5
B. H0: μd= 1.0
C. H0: μd= 1.5
D. H0: μd= 2.0
9. The...
 Economics- Probability and stats
1. Find the value of the 75th percentile of the following array: 5,10,43,9,8,6,2,5 A) 8 B) 9 C) 9.5 D) 8.5 2. Two independent events, A and B, where the P(B) is 0.44 and the probability that A does not occur or B occurs is 0.74. What is the probability that event A occurs? A) 0.3 B) 0.54 C) 0.46 D) 0.28 3. Which of the following is FALSE? A) B) A sampling distribution is a...
Economics- Probability and stats
1. Find the value of the 75th percentile of the following array: 5,10,43,9,8,6,2,5 A) 8 B) 9 C) 9.5 D) 8.5 2. Two independent events, A and B, where the P(B) is 0.44 and the probability that A does not occur or B occurs is 0.74. What is the probability that event A occurs? A) 0.3 B) 0.54 C) 0.46 D) 0.28 3. Which of the following is FALSE? A) B) A sampling distribution is a...
Most questions answered within 3 hours.
-
The pH of a sample of water from a river is 5.0. A
sample of effluent from...
asked 11 minutes ago -
At the beginning of the period, the Fabricating Department
budgeted direct labor of $136,500 and equipment...
asked 38 minutes ago -
Please answer all
____ 28. Rent control is usually
justified on the grounds that it protects...
asked 37 minutes ago -
PARTS A-D HAVE BEEN ANSWERED. WAS TOLD TO REPOST. ONLY ANSWER
PARTS E and F.
A...
asked 55 minutes ago -
2) You are given the task of finding a representation for a
circle in a drawing...
asked 2 hours ago -
STUDY QUESTION: Does use of diet drug fen-phen
(fenfluramine-phentermine) cause valvular heart disease?
HINT: Valvular heart...
asked 1 hour ago -
1. An object weighing 40 N rests on a surface. The coefficient
of friction is 0.35....
asked 3 hours ago -
Investor company owns 35% of investee company voting stock and
accounts for the investment under the...
asked 4 hours ago -
The number of major faults on a randomly chosen 1 km stretch of
highway has a...
asked 4 hours ago -
Consider the competitive environment of Starbuck's, Progressive
Insurance, a manufacturing firm with low turnover, or a...
asked 5 hours ago -
3. Gains from trade
Consider two neighbouring island countries called Euphoria and
Contente. They each have...
asked 7 hours ago -
A business executive has the option to invest money in two
plans: Plan A guarantees that...
asked 9 hours ago