Question
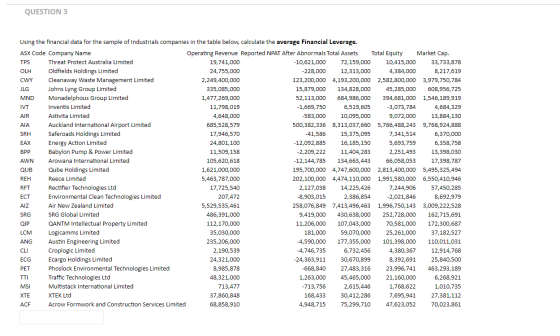
Using the financial data for the sample of Industrials companies in the table below, calculate the average Financial Leverage.
Homework Answers
Answer #1
| ASX CODE | COMPANY NAME | Total Assets($) | Total Equity($) | Total Debt($) | Financial Leverage |
| TPS | Threat Protect Australia Limited | 721,59,000 | 104,15,000 | 617,44,000 | 5.9284 |
| OLH | Oldfields Holdings Limited | 123,13,000 | 43,84,000 | 79,29,000 | 1.8086 |
| CWY | Cleanaway Waste Management Limited | 41932,00,000 | 25828,00,000 | 16104,00,000 | 0.6235 |
| JLG | Johns Lyng Group Limited | 1348,28,000 | 452,85,000 | 895,43,000 | 1.9773 |
| MND | Monadelphous Group Limited | 6849,86,000 | 3946,81,000 | 2903,05,000 | 0.7355 |
| IVT | Inventis Limited | 65,19,605 | -30,73,784 | 95,93,389 | -3.1210 |
| AIR | Astivita Limited | 100,95,000 | 90,72,000 | 10,23,000 | 0.1128 |
| AIA | Auckland International Airport Limited | 83130,37,660 | 57664,88,243 | 25465,49,417 | 0.4416 |
| SRH | Saferoads Holdings | 153,75,095 | 73,41,514 | 80,33,581 | 1.0943 |
| EAX | Energy Action Limited | 161,85,150 | 56,93,759 | 104,91,391 | 1.8426 |
| BPP | Babylon Pump & Power Limited | 114,04,283 | 22,51,493 | 91,52,790 | 4.0652 |
| AWN | Arowana International Limited | 1346,63,443 | 660,58,053 | 686,05,390 | 1.0386 |
| QUB | Qube Holdings Limited | 47476,00,000 | 28134,00,000 | 19342,00,000 | 0.6875 |
| REH | Reece Limited | 44741,10,000 | 19915,80,000 | 24825,30,000 | 1.2465 |
| RFT | Rectifier Technologies Limited | 142,25,426 | 72,44,906 | 69,80,520 | 0.9635 |
| ECT | Environmental Clean Technologies Limited | 23,86,854 | -20,21,846 | 44,08,700 | -2.1805 |
| AIZ | Air New Zealand Limited | 74134,96,463 | 19967,59,143 | 54167,37,320 | 2.7128 |
| SRG | SRG Global Limited | 4306,38,000 | 2527,28,000 | 1779,10,000 | 0.7040 |
| QIP | QANTM Intellectual Property Limited | 1070,43,000 | 705,81,000 | 364,62,000 | 0.5166 |
| LCM | Logicamms Limited | 590,70,000 | 252,61,000 | 338,09,000 | 1.3384 |
| ANG | Austin Engineering Limited | 1773,55,000 | 1013,98,000 | 759,57,000 | 0.7491 |
| CLI | Croplogic Limited | 67,32,456 | 43,80,367 | 23,52,089 | 0.5370 |
| ECG | Ecargo Holdings Limited | 306,70,899 | 83,92,691 | 222,78,208 | 2.6545 |
| PET | Phosloack Environmental Technologies Limited | 274,83,316 | 239,96,741 | 34,86,575 | 0.1453 |
| TTI | Traffic Technologies Ltd | 454,65,000 | 211,60,000 | 243,05,000 | 1.1486 |
| MSI | Multitack International Limited | 26,15,446 | 17,68,622 | 8,46,824 | 0.4788 |
| XTE | XTEK Ltd | 304,12,286 | 76,95,941 | 227,16,345 | 2.9517 |
| ACF | Acrow Formwoork and Costruction Services Limited | 752,99,710 | 476,23,052 | 276,76,658 | 0.5812 |
| Average Financial Leverage= | 1.1351 |
Know the answer?
Add Answer to:
Using the financial data for the sample of Industrials
companies in the table below, calculate the...
Not the answer you're looking for?
Ask your own homework help question.
Our experts will answer your question WITHIN MINUTES for Free.
Similar Homework Help Questions
Using the financial data for the sample of Healthcare companies in the table below, calculate the...
 Using the financial data for the sample of Healthcare
companies in the table below, calculate the number of companies
with a Return on Equity greater than 8%.
QUESTION 2 10 points Save Answer Using the financial data for the sample of Healthcare companies in the table below, calculate the number of companies with a Return on Equity greater than 8%. SDX TDL SIG ASX Code Company Name Sienna Cancer Diagnostics Limited TD1 TALI Digital Limited Visioneering Technologies Inc TBG Diagnostics...
Using the financial data for the sample of Healthcare
companies in the table below, calculate the number of companies
with a Return on Equity greater than 8%.
QUESTION 2 10 points Save Answer Using the financial data for the sample of Healthcare companies in the table below, calculate the number of companies with a Return on Equity greater than 8%. SDX TDL SIG ASX Code Company Name Sienna Cancer Diagnostics Limited TD1 TALI Digital Limited Visioneering Technologies Inc TBG Diagnostics...
ADVERTISEMENT
Need Online Homework Help?
Ask
a QuestionGet Answers For Free
Most questions answered within 3 hours.
Most questions answered within 3 hours.
ADVERTISEMENT
ADVERTISEMENT
Active Questions
-
Effect of DCMU and sodium azide on Chlamydomonas? We did an
experiment where we had Chlamydomonas...
asked 12 minutes ago -
1a) According to the ideal gas law, _______________.
a. a gas has infinite volume at absolute...
asked 1 hour ago -
Oakdale Fashions, Inc. had $245,000 in 2018 taxable income.
Using the tax schedule in Table 2.3...
asked 2 hours ago -
The marketing class at CSUS had an average score of 150. An
educational analyst determined that...
asked 3 hours ago -
Justin Case has purchased a $250 000 home by putting 20 % down
and taking out...
asked 3 hours ago -
1. In a labor market, marginal cost for a firm is
____________.
a. recruiting cost
b....
asked 4 hours ago -
On January 1, 2019, ABC Company issued $60,000,000 of 20-year,
10.5% bonds when the market rate...
asked 4 hours ago -
39.4% of US homes continue to use a landline in addition to cell
phone service. 3...
asked 5 hours ago -
Starting with benzene, synthesize 1-phenyl-1-butyne.
Show intermediates and reagents.
asked 6 hours ago -
Create a 32-run crossed array design with six control factors
and two noise factors such that...
asked 6 hours ago -
A 500g sample of sand from source A has the following amounts
retained on each sieve....
asked 7 hours ago -
In
your own words, please explain the essay by John Keynes wrote "The
End of Laissez...
asked 7 hours ago
ADVERTISEMENT