Complete this homework by R and put the syntaxes of R and corresponding outputs under respective question
[Example Question] Find the mean and the variance of milk yield data.
> mean(task)
[1] 36.15385
I apologized i put the wrong qs
Homework Answers
## R command
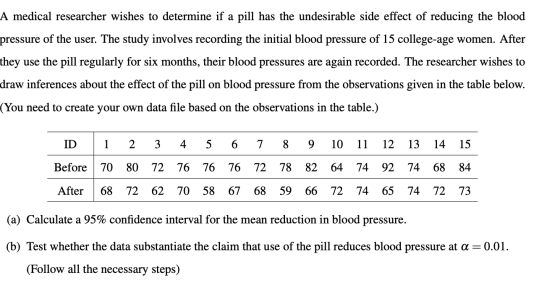
Before=c(70,80,72,76,76,76,72,78,82,64,74,92,74,68,84)
After=c(68,72,62,70,58,67,68,59,66,72,74,65,74,72,73)
## a) The 95% Confidence interval include in output of this
test
t.test(x=Before, y =After, alternative = "greater", paired
=TRUE,
conf.level = 0.95)
## End
Let, d=Before=After
Hypothesis


The 95% confidence interval for the true population mean reduction in blood pressure is (3.580296, infinity). Hence, the true population mean reduction in blood pressure falls in this interval with 95% confidence.
b) The p-value of the test is 0.003009 and less than 0.01 significance level. Hence, we can reject the null hypothesis and accept the claim that the pill has the undesirable side effect of reducing the blood pressure of the user at the 0.01 significance level.
Add Answer to:
Complete this homework by R and put the syntaxes of R and
corresponding outputs under respective...
Do this homework by R and put the syntax of R and corresponding outputs under respective...
Do this homework by R and put the syntax of R and corresponding outputs under respective questions. Do not turn in separate pages of R commands and outputs, such homework will not be graded. Therefore edit your homework accordingly. 1. A national equal employment opportunities committee is conducting an investigation to determine if women employees are as well paid as their male counterparts in comparable jobs. Random samples of 75 males and 64 females in junior academic positions are selected...
Excel Homework #1 1. A researcher is interested in describing the distribution of blood types. She...
Excel Homework #1 1. A researcher is interested in describing the distribution of blood types. She selects a random sample of forty patient files in an immediate care clinic and records the blood type on each. The data is shown: A; B; O; A; AB; O; O; A; O; B; A; A; A; O; O; O; B; O; AB; B O; B; O; AB; B; O; O; A; O; B; A; O; A; O; A; A; B; O;...
Trying to verify my answers and R code. Please help!!! The State of Florida has decided to use a factorial design to compare five high schools offering Inter- national Baccalaureate programs with reg...
 Trying to verify my answers and R code. Please help!!!
The State of Florida has decided to use a factorial design to compare five high schools offering Inter- national Baccalaureate programs with regard to how well the students are doing on a standardized test. Four courses are examined, each with three years of data. The data is as follows, Courses High School IV 48, 44, 46 62, 66, 64 54, 46, 50 57, 53, 55 53, 47, 50 70, 66,...
Trying to verify my answers and R code. Please help!!!
The State of Florida has decided to use a factorial design to compare five high schools offering Inter- national Baccalaureate programs with regard to how well the students are doing on a standardized test. Four courses are examined, each with three years of data. The data is as follows, Courses High School IV 48, 44, 46 62, 66, 64 54, 46, 50 57, 53, 55 53, 47, 50 70, 66,...
Recorded in the table below are the blood pressure measurements (in millimeters) for a sample of...
 Recorded in the table below are the blood pressure measurements (in millimeters) for a sample of 12 adults. Does there appear to be a linear relationship between the diastolic ar systolic blood pressures? At the 5% significance level, test the claim that systolic blood pressure and diastolic blood pressure have a linear relationship. Systolic Diastolic 108 69 130 76 110 74 112 75 113 77 115 83 105 66 116 70 133 91 154 94 119 69 118 88 Data...
Find the means. The mean for systolic is__ mm Hg and the mean for diastolic is__...
 Find the means.
The mean for systolic is__ mm Hg and the mean for diastolic
is__ mm Hg.
(Type integers or decimals rounded to one decimal place
asneeded.)
Find the medians.
The median for systolic is___ mm Hg and the median for
diastolic is___mm Hg.
(Type integers or decimals rounded to one decimal place
asneeded.)
Compare the results. Choose the correct answer
below.
A. The mean is lower for the diastolic pressure, but the median is
lower for the systolic...
Find the means.
The mean for systolic is__ mm Hg and the mean for diastolic
is__ mm Hg.
(Type integers or decimals rounded to one decimal place
asneeded.)
Find the medians.
The median for systolic is___ mm Hg and the median for
diastolic is___mm Hg.
(Type integers or decimals rounded to one decimal place
asneeded.)
Compare the results. Choose the correct answer
below.
A. The mean is lower for the diastolic pressure, but the median is
lower for the systolic...
Analyze the sample data given in the table below and provide reasons for changes in heart...
 Analyze the sample data given in the table below and provide reasons for changes in heart rate and Mean Arterial Pressure during lying down, exercise and holding breath as compared to sitting. Please type your answer and upload the document to the dropbox with the following file name format: Last name firstname HR MAP.docx Example Doe John HR MAP.docx The file should be uploaded by 11.59 pm Sunday 3/22/20. Late submissions will not be accepted. # 1 Sitting HR 7...
Please write the R code to solve the question. Problem (2). In an effort to link...
 Please write the R code to solve the question.
Problem (2). In an effort to link cold environments with hypertension in humans, a preliminary experiment was conducted to investigate the effect of cold on hypertension in rats. Two random samples of 6 rats each were exposed to different environments. One sample of rats were held in a normal environment at 26°C. The other sample was held in a cold 5°C environment. Blood pressures and heart rates were measured for rats...
Please write the R code to solve the question.
Problem (2). In an effort to link cold environments with hypertension in humans, a preliminary experiment was conducted to investigate the effect of cold on hypertension in rats. Two random samples of 6 rats each were exposed to different environments. One sample of rats were held in a normal environment at 26°C. The other sample was held in a cold 5°C environment. Blood pressures and heart rates were measured for rats...
temperature gender hr 96.3 1 70 96.7 1 71 96.9 1 74 97 1 80 97.1...
 temperature
gender
hr
96.3
1
70
96.7
1
71
96.9
1
74
97
1
80
97.1
1
73
97.1
1
75
97.1
1
82
97.2
1
64
97.3
1
69
97.4
1
70
97.4
1
68
97.4
1
72
97.4
1
78
97.5
1
70
97.5
1
75
97.6
1
74
97.6
1
69
97.6
1
73
97.7
1
77
97.8
1
58
97.8
1
73
97.8
1
65
97.8
1
74
97.9
1
76
97.9
1
72
98
1...
temperature
gender
hr
96.3
1
70
96.7
1
71
96.9
1
74
97
1
80
97.1
1
73
97.1
1
75
97.1
1
82
97.2
1
64
97.3
1
69
97.4
1
70
97.4
1
68
97.4
1
72
97.4
1
78
97.5
1
70
97.5
1
75
97.6
1
74
97.6
1
69
97.6
1
73
97.7
1
77
97.8
1
58
97.8
1
73
97.8
1
65
97.8
1
74
97.9
1
76
97.9
1
72
98
1...
2. Using the data set of the Health Exam Results, conduct the following analysis between the variables of weight (WT) and Body Mass Index (BMI). Number the data set from 1 to 40, and select the...
 2. Using the data set of the Health Exam Results, conduct the following analysis between the variables of weight (WT) and Body Mass Index (BMI). Number the data set from 1 to 40, and select the following individuals: . Set 1 (Malo): 1, 5, 10, 13, 15, 18, 19, 24, 29, 31, 32, 33 .Set 2 (Fomalo): 4, 9, 15, 16, 17, 22, 23, 29, 33, 37, 38, 40 Draw a scatter diagram of the sample of 12 data set...
1) Answer the question True or False. 1) Nonparametric methods focus on the location of the...
 1) Answer the question True or False. 1) Nonparametric methods focus on the location of the probability distribution, rather than on specific parameters of the population. A) True B) False 2) Nonparametric tests are useful for qualitative data that can be ranked. A) True B) False 3) The sign test provides inferences about the population median rather than the population mean. A) True B) False 4) For a sign test to be valid, a large sample must be selected from...
 Trying to verify my answers and R code. Please help!!!
The State of Florida has decided to use a factorial design to compare five high schools offering Inter- national Baccalaureate programs with regard to how well the students are doing on a standardized test. Four courses are examined, each with three years of data. The data is as follows, Courses High School IV 48, 44, 46 62, 66, 64 54, 46, 50 57, 53, 55 53, 47, 50 70, 66,...
Trying to verify my answers and R code. Please help!!!
The State of Florida has decided to use a factorial design to compare five high schools offering Inter- national Baccalaureate programs with regard to how well the students are doing on a standardized test. Four courses are examined, each with three years of data. The data is as follows, Courses High School IV 48, 44, 46 62, 66, 64 54, 46, 50 57, 53, 55 53, 47, 50 70, 66,...
 Recorded in the table below are the blood pressure measurements (in millimeters) for a sample of 12 adults. Does there appear to be a linear relationship between the diastolic ar systolic blood pressures? At the 5% significance level, test the claim that systolic blood pressure and diastolic blood pressure have a linear relationship. Systolic Diastolic 108 69 130 76 110 74 112 75 113 77 115 83 105 66 116 70 133 91 154 94 119 69 118 88 Data...
 Find the means.
The mean for systolic is__ mm Hg and the mean for diastolic
is__ mm Hg.
(Type integers or decimals rounded to one decimal place
asneeded.)
Find the medians.
The median for systolic is___ mm Hg and the median for
diastolic is___mm Hg.
(Type integers or decimals rounded to one decimal place
asneeded.)
Compare the results. Choose the correct answer
below.
A. The mean is lower for the diastolic pressure, but the median is
lower for the systolic...
Find the means.
The mean for systolic is__ mm Hg and the mean for diastolic
is__ mm Hg.
(Type integers or decimals rounded to one decimal place
asneeded.)
Find the medians.
The median for systolic is___ mm Hg and the median for
diastolic is___mm Hg.
(Type integers or decimals rounded to one decimal place
asneeded.)
Compare the results. Choose the correct answer
below.
A. The mean is lower for the diastolic pressure, but the median is
lower for the systolic...
 Analyze the sample data given in the table below and provide reasons for changes in heart rate and Mean Arterial Pressure during lying down, exercise and holding breath as compared to sitting. Please type your answer and upload the document to the dropbox with the following file name format: Last name firstname HR MAP.docx Example Doe John HR MAP.docx The file should be uploaded by 11.59 pm Sunday 3/22/20. Late submissions will not be accepted. # 1 Sitting HR 7...
 Please write the R code to solve the question.
Problem (2). In an effort to link cold environments with hypertension in humans, a preliminary experiment was conducted to investigate the effect of cold on hypertension in rats. Two random samples of 6 rats each were exposed to different environments. One sample of rats were held in a normal environment at 26°C. The other sample was held in a cold 5°C environment. Blood pressures and heart rates were measured for rats...
Please write the R code to solve the question.
Problem (2). In an effort to link cold environments with hypertension in humans, a preliminary experiment was conducted to investigate the effect of cold on hypertension in rats. Two random samples of 6 rats each were exposed to different environments. One sample of rats were held in a normal environment at 26°C. The other sample was held in a cold 5°C environment. Blood pressures and heart rates were measured for rats...
 temperature
gender
hr
96.3
1
70
96.7
1
71
96.9
1
74
97
1
80
97.1
1
73
97.1
1
75
97.1
1
82
97.2
1
64
97.3
1
69
97.4
1
70
97.4
1
68
97.4
1
72
97.4
1
78
97.5
1
70
97.5
1
75
97.6
1
74
97.6
1
69
97.6
1
73
97.7
1
77
97.8
1
58
97.8
1
73
97.8
1
65
97.8
1
74
97.9
1
76
97.9
1
72
98
1...
temperature
gender
hr
96.3
1
70
96.7
1
71
96.9
1
74
97
1
80
97.1
1
73
97.1
1
75
97.1
1
82
97.2
1
64
97.3
1
69
97.4
1
70
97.4
1
68
97.4
1
72
97.4
1
78
97.5
1
70
97.5
1
75
97.6
1
74
97.6
1
69
97.6
1
73
97.7
1
77
97.8
1
58
97.8
1
73
97.8
1
65
97.8
1
74
97.9
1
76
97.9
1
72
98
1...
 2. Using the data set of the Health Exam Results, conduct the following analysis between the variables of weight (WT) and Body Mass Index (BMI). Number the data set from 1 to 40, and select the following individuals: . Set 1 (Malo): 1, 5, 10, 13, 15, 18, 19, 24, 29, 31, 32, 33 .Set 2 (Fomalo): 4, 9, 15, 16, 17, 22, 23, 29, 33, 37, 38, 40 Draw a scatter diagram of the sample of 12 data set...
 1) Answer the question True or False. 1) Nonparametric methods focus on the location of the probability distribution, rather than on specific parameters of the population. A) True B) False 2) Nonparametric tests are useful for qualitative data that can be ranked. A) True B) False 3) The sign test provides inferences about the population median rather than the population mean. A) True B) False 4) For a sign test to be valid, a large sample must be selected from...
Most questions answered within 3 hours.
-
Why has California been the favorite destination of large number
of secondary migrants?
asked 11 seconds from now -
Do not neglect the old for the new. The existing business must
not lose priority simply...
asked 3 hours ago -
Kylie is a single mom with two dependent children,
Tanner, age 7 and Olivia, age 11....
asked 4 hours ago -
Phosphorous + bromine = phosphorous tribromide. If 35.0 g of
bromine are reacted and 27.9 grams...
asked 5 hours ago -
Derive the long wavelength limit of the Planck energy density
distribution
asked 5 hours ago -
Calculate the pH of each of the following solutions.
0.50 M HBr
3.1×10⁻⁴ M KOH
4.2×10⁻⁵...
asked 9 hours ago -
For the year ended December 31, Depot Max’s cost of merchandise
sold was $85,600. Inventory at the...
asked 9 hours ago -
Week 10 - Professional Memo Assignment
Professional Memo Assignment
Your mission for this week, should you...
asked 9 hours ago -
Write a Python program that stores the data for each
player on the team, and it...
asked 9 hours ago -
In
the last 3 months, mike never knows when he is going to get his
allowance...
asked 9 hours ago -
Is Ca(OH)2 a Bronsted base, Lewis base, or both? Why?
asked 9 hours ago -
1A- Why don’t voters complain about U.S. tariffs on imported
sugar?
Because sugar is only a...
asked 9 hours ago