


Homework Answers


Therefore
a) P(X<40) = 0.9938
b) P(X>21) = 0.9878
c) P(30<X<35) = 0.3944
According to HomeworkLib policy answered only first question for remaining please repost the question.
Add Answer to:
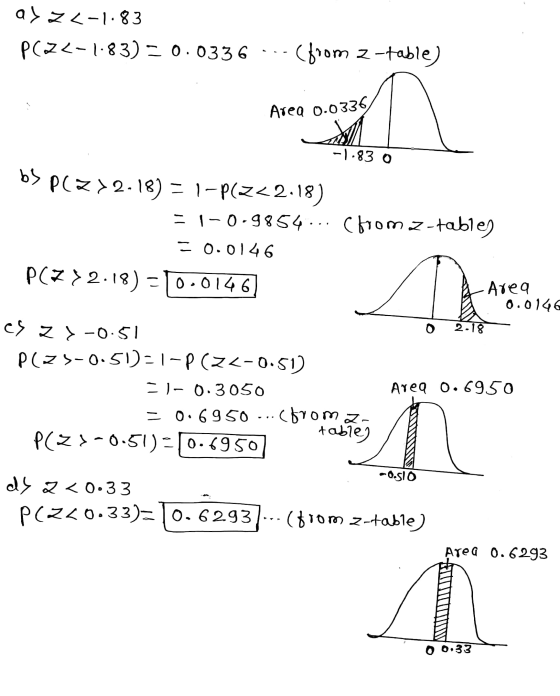
1. Use Table A to find the proportion of observations from a standard Normal distribution that...
The heights of women aged 20 to 29 are approximately Normal with mean 64 inches and...
The heights of women aged 20 to 29 are approximately Normal with mean 64 inches and standard deviation 2.7 inches. Men the same age have mean height 69.3 inches with standard deviation 2.8 inches. What is the z-score for a woman 60 inches tall? z-score = What is the z-score for a man 76 inches tall? z-score = Find the z-score corresponding to: (a) The percentile 0.5 z = (b) The percentile 0.9826 z = (c) The percentile 0.1423 z...
Question 3: Consider the Standard Normal Distribution with mean 0 and standard deviation 1. Find the...
 Question 3: Consider the Standard Normal Distribution with mean 0 and standard deviation 1. Find the following. a) P (z>0.5) b) P(z 1.5) c) P (-0.49 < z1.5) Question 4: If you have a normal distribution with mean 14 and standard deviation of 2. What is P(x >16)? Question 5 Professor Hardy assumes the exam scores are normally distributed and wants to grade "on a curve." The mean score was 68, with a standard deviation of 9, If he wants...
NO HANDWRITTEN ANSWERS PLEASE For the standard normal curve, find the z-score that corresponds to the...
NO HANDWRITTEN ANSWERS PLEASE For the standard normal curve, find the z-score that corresponds to the 30th percentile. Find the z-score for which 99% of the distribution’s area lies between –z and z. Assume that the heights of men are normally distributed with a mean of 69.0 inches and a standard deviation of 2.8 inches. If 64 men are randomly selected, find the probability that they have a mean height between 68 and 70 inches. An airline reports that it...
1. The distribution of heights of adult men is Normal, with a mean of 69 inches...
1. The distribution of heights of adult men is Normal, with a mean of 69 inches and a standard deviation of 2 inches. Gary’s height has a z-score of 0.5 when compared to all adult men. Interpret what this z-score tells about how Gary’s height. A. Gary is one standard deviation above the mean. B. 68% of adult men are shorter than Gary. C. Gary is 70 inches tall. D. All of the above are correct answers. 2. The mean...
Find the indicated z score. The graph depicts the standard normal distribution with mean 0 and...
 Find the indicated z score. The graph depicts the standard normal distribution with mean 0 and standard deviation 1. 13) Shaded area is 0.9599. A) - 1.38 B) 1.03 1.82 D) 1.75 14) Shaded area is 0.0694. A) 1.45 B) 1.26 1.48 D) 1.39Find the indicated value. 15) z0.005 A) 2.535 D) 2.015 92.835 B) 2.575 16) z0.36 A) 1.76 B) 0.45 1.60 D) 0.36 Provide an appropriate response. 17) Find the area of the shaded region. The graph depicts IQ scores of adults, and those scores are normally distributed...
1) Given a standard normal distribution, find the probability of having a z score higher than...
1) Given a standard normal distribution, find the probability of having a z score higher than 1.67 ```{r} ``` 2) Given that test scores for a class are normally distributed with a mean of 80 and variance 36, find the probability that a test score is lower than a 45. ```{r} ``` 3) Given a standard normal distribution, find the Z score associated with a probability of .888 ```{r} ``` 4) Find the Z score associated with the 33rd quantile...
5. Use the normal distribution of SAT critical reading scores for which the mean is 513...
 5. Use the normal distribution of SAT critical reading scores for which the mean is 513 and the standard deviation is 111. Assume the variable x is normally distributed. (a) What percent of the SAT verbal scores are less than 650? (b) If 1000 SAT verbal scores are randomly selected, about how many would you expect to be greater than 575? (a) Approximately % of the SAT verbal scores are less than 650 (Round to two decimal places as needed.)...
this three questions 3.22 The proportion of observations from a standard Normal distribution that take values...
 this three questions
3.22 The proportion of observations from a standard Normal distribution that take values greater than 1.78 is about (a) 0.9554. (b) 0.0446. (c) 0.0375. The proportion of observations from a standard Normal distribution that take values between 1 and 2 is about (a) 0.025. (b) 0.135. (c) 0.160. The scores of adults on an IQ test are approximately Normal with mean 100 and standard deviation 15 Alysha scores 135 on such a test. She scores higher than...
this three questions
3.22 The proportion of observations from a standard Normal distribution that take values greater than 1.78 is about (a) 0.9554. (b) 0.0446. (c) 0.0375. The proportion of observations from a standard Normal distribution that take values between 1 and 2 is about (a) 0.025. (b) 0.135. (c) 0.160. The scores of adults on an IQ test are approximately Normal with mean 100 and standard deviation 15 Alysha scores 135 on such a test. She scores higher than...
27. On a standardized test with a normal distribution, the mean was 64.3 and the standard...
 27. On a standardized test with a normal distribution, the mean was 64.3 and the standard deviation was 5.4. What is the best approximation of the percent of scores that fell between 61.6 and 75.1? 28. The mean of a normally distributed set of data is 52 and the standard deviation is 4. Approximately 95% of all the cases will lie between which measures? 29. Battery lifetime is normally distributed for large samples. The mean lifetime is 500 days and...
1. The distribution of heights of adult females: We assume that height is normally distributed with...
1. The distribution of heights of adult females: We assume that height is normally distributed with a population mean of 65 inches and a population standard deviation of 4 inches. 2. The distribution of heights of adult males: We assume that height is normally distributed with a population mean of 70 inches and a population standard deviation of 5 inches. a. Above what Z-score value does 2.5% of the normal distribution fall? Using the formula for Z-scores and the Z-score...
 Question 3: Consider the Standard Normal Distribution with mean 0 and standard deviation 1. Find the following. a) P (z>0.5) b) P(z 1.5) c) P (-0.49 < z1.5) Question 4: If you have a normal distribution with mean 14 and standard deviation of 2. What is P(x >16)? Question 5 Professor Hardy assumes the exam scores are normally distributed and wants to grade "on a curve." The mean score was 68, with a standard deviation of 9, If he wants...
 5. Use the normal distribution of SAT critical reading scores for which the mean is 513 and the standard deviation is 111. Assume the variable x is normally distributed. (a) What percent of the SAT verbal scores are less than 650? (b) If 1000 SAT verbal scores are randomly selected, about how many would you expect to be greater than 575? (a) Approximately % of the SAT verbal scores are less than 650 (Round to two decimal places as needed.)...
 this three questions
3.22 The proportion of observations from a standard Normal distribution that take values greater than 1.78 is about (a) 0.9554. (b) 0.0446. (c) 0.0375. The proportion of observations from a standard Normal distribution that take values between 1 and 2 is about (a) 0.025. (b) 0.135. (c) 0.160. The scores of adults on an IQ test are approximately Normal with mean 100 and standard deviation 15 Alysha scores 135 on such a test. She scores higher than...
this three questions
3.22 The proportion of observations from a standard Normal distribution that take values greater than 1.78 is about (a) 0.9554. (b) 0.0446. (c) 0.0375. The proportion of observations from a standard Normal distribution that take values between 1 and 2 is about (a) 0.025. (b) 0.135. (c) 0.160. The scores of adults on an IQ test are approximately Normal with mean 100 and standard deviation 15 Alysha scores 135 on such a test. She scores higher than...
 27. On a standardized test with a normal distribution, the mean was 64.3 and the standard deviation was 5.4. What is the best approximation of the percent of scores that fell between 61.6 and 75.1? 28. The mean of a normally distributed set of data is 52 and the standard deviation is 4. Approximately 95% of all the cases will lie between which measures? 29. Battery lifetime is normally distributed for large samples. The mean lifetime is 500 days and...
Most questions answered within 3 hours.
-
New Air Heating and Cooling, manufactures furnaces and central
air units. The company pride itself on...
asked 2 minutes from now -
A coach uses a new technique to train gymnasts. Seven
gymnasts were randomly selected and their...
asked 1 hour ago -
While rotating the tires on your car you notice a rock [mass =
0.1 Kg] stuck...
asked 3 hours ago -
Using MARS simulator, write MIPS programs according to
the following scenarios: Receive a positive integer number...
asked 5 hours ago -
An object in front of a concave mirror has a real image that is
11.5 cm...
asked 5 hours ago -
Consider the reaction, C3 H8 + O2 --> CO2 + H2O. How many
moles of O2...
asked 7 hours ago -
You and your opponent both roll a fair die. If you both roll the
same number,...
asked 8 hours ago -
In a study of the accuracy of fast food drive-through orders,
Restaurant A had 257 accurate...
asked 8 hours ago -
Identify and describe in detail the four categories of
institutions that could be included in a...
asked 8 hours ago -
In python
class Customer:
def __init__(self, customer_id, last_name, first_name, phone_number, address):
self._customer_id = int(customer_id)
self._last_name =...
asked 8 hours ago -
What is an example of a limitation in implementing a new
ERP system and how it...
asked 8 hours ago -
In a section of 9.7cm of an artery with a radius of 2.6mm there
is a...
asked 8 hours ago