The following table contains information on matched sample values whose differences are normally distributed. Use Table...
|
The following table contains information on matched sample values whose differences are normally distributed. Use Table 2. |
| Number | Sample 1 | Sample 2 |
| 1 | 16 | 20 |
| 2 | 12 | 13 |
| 3 | 20 | 22 |
| 4 | 20 | 22 |
| 5 | 17 | 20 |
| 6 | 14 | 16 |
| 7 | 16 | 18 |
| 8 | 18 | 21 |
| a. |
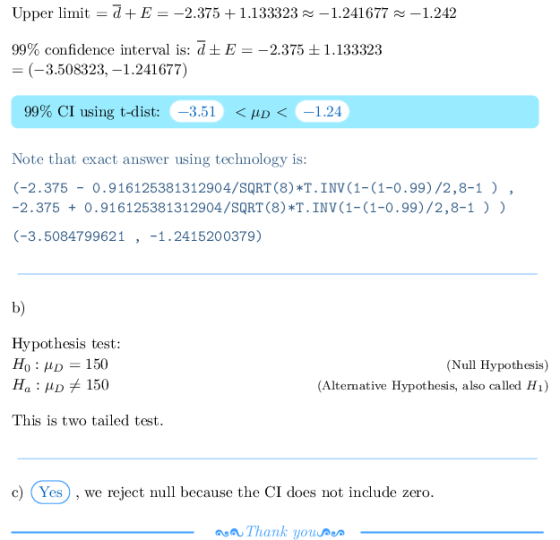
Construct the 99% confidence interval for the mean difference μD. (Negative values should be indicated by a minus sign. Round all intermediate calculations to at least 4 decimal places. Round your answers to 2 decimal places.) |
| Confidence interval is to |
| b. |
Specify the competing hypotheses in order to test whether the mean difference differs from zero. |
||||||
|
| c. |
Using the confidence interval from part a, are you able to reject H0? |
||||
|
Homework Answers

Add Answer to:
The following table contains information on matched sample
values whose differences are normally distributed. Use Table...
The following table contains information on matched sample values whose differences are normally distributed. (You may...
The following table contains information on matched sample values whose differences are normally distributed. (You may find it useful to reference the appropriate table: z table or t table) Number Sample 1 Sample 2 1 18 22 2 13 11 3 22 23 4 23 20 5 17 21 6 14 16 7 18 18 8 19 20 Construct the 99% confidence interval for the mean difference μD. (Negative values should be indicated by a minus sign. Round intermediate calculations...
The following table contains information on matched sample values whose differences are normally distributed. (You may...
The following table contains information on matched sample values whose differences are normally distributed. (You may find it useful to reference the appropriate table: z table or t table) Number Sample 1 Sample 2 1 17 20 2 12 12 3 21 22 4 21 20 5 16 21 6 14 16 7 17 18 8 17 20 a. Construct the 90% confidence interval for the mean difference μD. (Negative values should be indicated by a minus sign. Round intermediate...
The following table contains information on matched sample values whose differences are normally distributed. (You may find it useful to reference the appropriate table: z table or t table)
 The following table contains information on matched sample values whose differences are normally distributed. (You may find it useful to reference the appropriate table: z table or t table) NumberSample 1Sample 21162021213320224202251720614167161881821 a. Construct the 99% confidence interval for the mean difference μD. (Negative values should be indicated by a minus sign. Round intermediate calculations to at least 4 decimal places and final answers to 2 decimal places.)
The following table contains information on matched sample values whose differences are normally distributed. Number -...
The following table contains information on matched sample values whose differences are normally distributed. Number - Sample 1 - Sample 2 1 17 21 2 12 13 3 21 22 4 23 19 5 19 19 6 13 17 7 19 16 8 17 21 a. Construct the 95% confidence interval for the mean difference μD.
The following table contains information on matched sample values whose differences are normally distributed. (You may...
 The following table contains information on matched sample values whose differences are normally distributed. (You may find it useful to reference the appropriate table: z table or t table) Number Sample 1 16 Sample 2 21 10 12 WN 00 O a. Construct the 90% confidence interval for the mean difference up. (Negative values should be indicated by a minus sign. Round intermediate calculations to at least 4 decimal places and final answers to 2 decimal places.) Confidence interval is...
Consider the following data drawn independently from normally distributed populations: (You may find it useful to...
 Consider the following data drawn independently from normally distributed populations: (You may find it useful to reference the appropriate table: z table or t table) 21 = 29.8 012 - 95.3 nu = 34 22 = 32.4 oz? = 91.6 ng = 29 a. Construct the 99% confidence interval for the difference between the population means. (Negative values should be indicated by a minus sign. Round all intermediate calculations to at least 4 decimal places and final answers to 2...
Consider the following data drawn independently from normally distributed populations: (You may find it useful to...
Consider the following data drawn independently from normally distributed populations: (You may find it useful to reference the appropriate table: z table or t table) x−1x−1 = 27.7 x−2x−2 = 30.1 σ12 = 92.8 σ22 = 87.5 n1 = 24 n2 = 33 a. Construct the 99% confidence interval for the difference between the population means. (Negative values should be indicated by a minus sign. Round all intermediate calculations to at least 4 decimal places and final answers to 2...
Consider the following competing hypotheses: (You may find it useful to reference the appropriate table: z...
Consider the following competing hypotheses: (You may find it useful to reference the appropriate table: z table or t table) Hypotheses: H0: μD ≤ 2; HA: μD > 2 Sample results: d−d− = 5.6, sD = 6.2, n = 10 The following results are obtained using matched samples from two normally distributed populations: a. Calculate the value of the test statistic, assuming that the sample difference is normally distributed. (Round all intermediate calculations to at least 4 decimal places and...
Suppose a sample of 49 paired differences that have been randomly selected from a normally distributed...
Suppose a sample of 49 paired differences that have been randomly selected from a normally distributed population of paired differences yields a sample mean d¯ =4.2 of and a sample standard deviation of sd = 7.6. (a) Calculate a 95 percent confidence interval for µd = µ1 – µ2. Can we be 95 percent confident that the difference between µ1 and µ2 is greater than 0? (Round your answers to 2 decimal places.) Confidence interval = [ ? , ?...
Suppose a sample of 49 paired differences that have been randomly selected from a normally distributed...
Suppose a sample of 49 paired differences that have been randomly selected from a normally distributed population of paired differences yields a sample mean d¯ =5.0d¯ =5.0 of and a sample standard deviation of sd = 7.8. (a) Calculate a 95 percent confidence interval for µd = µ1 – µ2. Can we be 95 percent confident that the difference between µ1 and µ2 is greater than 0? (Round your answers to 2 decimal places.) Confidence interval = [ , ] ;...
 The following table contains information on matched sample values whose differences are normally distributed. (You may find it useful to reference the appropriate table: z table or t table) Number Sample 1 16 Sample 2 21 10 12 WN 00 O a. Construct the 90% confidence interval for the mean difference up. (Negative values should be indicated by a minus sign. Round intermediate calculations to at least 4 decimal places and final answers to 2 decimal places.) Confidence interval is...
 Consider the following data drawn independently from normally distributed populations: (You may find it useful to reference the appropriate table: z table or t table) 21 = 29.8 012 - 95.3 nu = 34 22 = 32.4 oz? = 91.6 ng = 29 a. Construct the 99% confidence interval for the difference between the population means. (Negative values should be indicated by a minus sign. Round all intermediate calculations to at least 4 decimal places and final answers to 2...
Most questions answered within 3 hours.
-
A statistics student finds herself struggling with a newspaper
article stating that only eighteen percent of...
asked 18 minutes ago -
People with beriberi, a disease caused by a thiamin deficiency,
have elevated levels of blood pyruvate...
asked 5 minutes ago -
PYTHON Programming Exercise 2: Create a Simple Cost Calculator
Write a program that displays input fields...
asked 11 minutes ago -
1.Seki agreed that Groupon could sell 18 hot air
balloon rides on his Magical Adventures company...
asked 12 minutes ago -
A cohort study is conducted to determine whether smoking is
associated with an increased risk of...
asked 17 minutes ago -
Create the pseudo-code/flowchart for an application class named
Monogram. Its main() method inputs three variables that...
asked 18 minutes ago -
How many liters of water are required to dissolve 1.00 g of
silver chromate? Express your...
asked 21 minutes ago -
Hot: T_inlet = 80, T_out = 65
Cold: T_inlet = 10, T_out = 25
Explain in...
asked 21 minutes ago -
Two protons fly in different directions and collide. They both
have a total energy of 1.5...
asked 30 minutes ago -
What is the oxidation number of each atom in sodium phosphate,
Na3PO4?
>>> SHOW YOUR WORK...
asked 36 minutes ago -
D company purchased goods with a list price of $60000, subject
to trade discounts of 20%...
asked 39 minutes ago -
Transposable elements make up more than 40% of the human genome
and are inserted more-or-less randomly...
asked 50 minutes ago