Suppose you wish to compare the means of six populations based on independent random samples, each...
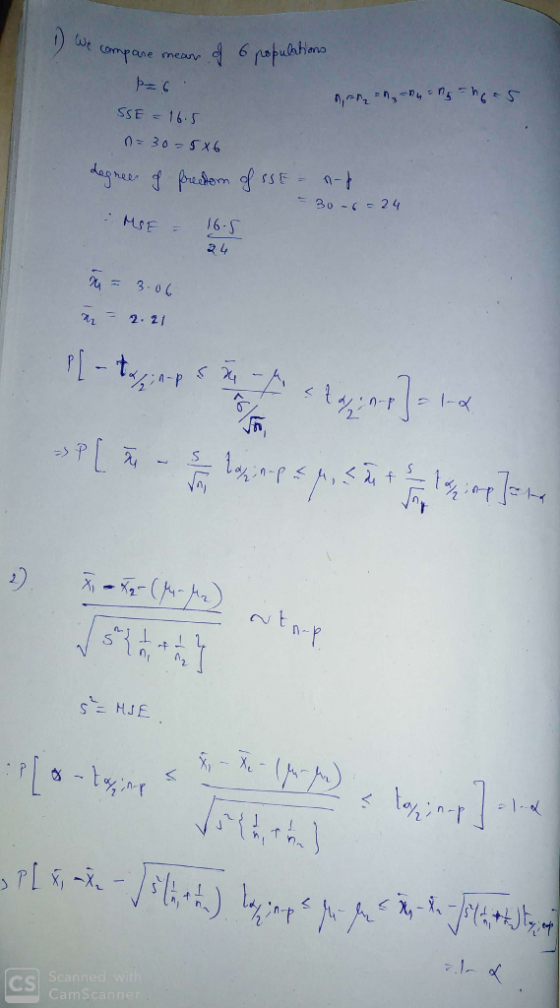
Suppose you wish to compare the means of six populations based on independent random samples, each of which contains 5 observations. The values of Total SS and SSE for the experiment are Total SS = 21.1 and SSE = 16.5. The sample means corresponding to populations 1 and 2 are x1 = 3.06 and x2 = 2.21.
1. Find a 95% confidence interval for μ1. (Round your
answers to three decimal places.)
2. Find a 95% confidence interval for the difference (μ1
− μ2). (Round your answers to three decimal
places.)
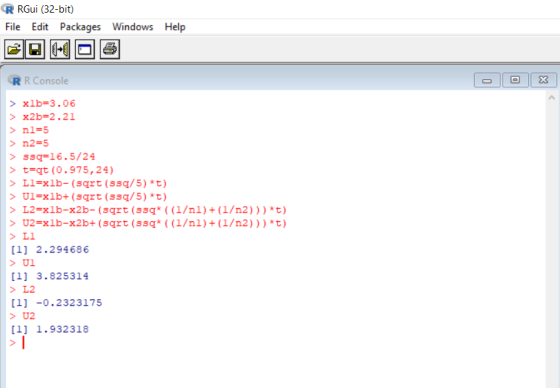
I need help understanding how they obtained the correct answers (2.295, 3.825) for question 1 and (-0.232, 1.932) for question 2. Thanks!
Homework Answers
I have used R to find the values
Add Answer to:
Suppose you wish to compare the means of six populations based
on independent random samples, each...
In order to compare the means of two populations, independent random samples of 400 observations are...
In order to compare the means of two populations, independent random samples of 400 observations are selected from each population, with the results found in the table to the right. Complete parts a through e below. Sample 1 overbar x = 5,305 s1= 154 Sample 2 overbar x = 5,266 s2 = 199 a. Use a 95% confidence interval to estimate the difference between the population means (mu 1 - mu 2). Interpret the confidence interval. The confidence interval is...
Independent random samples were selected from two quantitative populations, with sample sizes, means, and standard deviations...
Independent random samples were selected from two quantitative populations, with sample sizes, means, and standard deviations given below. n1 = n2 = 60 x1 = 125.3 x2 = 123.4 s1 = 5.7 s2 = 6.1 a) Construct a 95% confidence interval for the difference in the population means (μ1 − μ2). (Round your answers to two decimal places.) to b) Find a point estimate for the difference in the population means. c) Calculate the margin of error. (Round your answer...
In order to compare the means of two populations, independent random samples of 395 observations are...
 In order to compare the means of two populations, independent random samples of 395 observations are selected from each population, with the results found in the table to the right. Complete parts a through e below. Sample 2 x2 = 5,250 2-210 Sample 1 X,5,279 1-140 a. Use a 95% confidence interval to estimate the difference between the population means (μ1-μ2) . Interpret the confidence The confidence interval is Round to one decimal place as needed.) Interpret the confidence interval....
Independent random samples were selected from two quantitative populations, with sample sizes, means, and variances given...
Independent random samples were selected from two quantitative populations, with sample sizes, means, and variances given below. Population 1 2 Sample Size 39 44 Sample Mean 9.3 7.3 Sample Variance 8.5 14.82 Construct a 90% confidence interval for the difference in the population means. (Use μ1 − μ2. Round your answers to two decimal places.) __________ to ____________ Construct a 99% confidence interval for the difference in the population means. (Round your answers to two decimal places.) __________ to _____________
Independent random samples selected from two normal populations produced the sample means and standard dev atons...
 Independent random samples selected from two normal populations produced the sample means and standard dev atons shown to the right. a. Assuming equal variances, conduct the test Ho: (μι-μ2)-U against Ha: μι-μ2) #0 using α .10. b. Find and interpret the 90% confidence interval for(μ1-μ2) Sample 1 Sample 2 x1 59 x2-7.9 13 2-4.8 a. Find the trst statistic. The test statistic is Round to two decimal places as needed.) ind the p vaue. The p-value is Round to three...
The information below is based on independent random samples taken from two normally distributed populations having...
 The information below is based on independent random samples taken from two normally distributed populations having equal variances. Based on the sample information, determine the 95% confidence interval estimate for the difference between the two population means. n1 14 x145 n2 13 2 47 The 95% confidence interval is s (μ1-12) s Round to two decimal places as needed)
Two random samples are selected from two independent populations. A summary of the samples sizes, sample...
Two random samples are selected from two independent populations. A summary of the samples sizes, sample means, and sample standard deviations is given below: n1=51, n2=46, x¯1=57.8, x¯2=75.3, s1=5.2 s2=11 Find a 94.5% confidence interval for the difference μ1−μ2μ1−μ2 of the means, assuming equal population variances. Confidence Interval =
9.1 Suppose that you wish to compare the means of six samples, each of which contains...
 9.1 Suppose that you wish to compare the means of six samples, each of which contains ten observations. Insert in an ANOVA table the sources of variation and their respective degrees of freedom. The values of Total SS and SSE for the experiment in Exercise 9.1 are Total SS SSE-16.2 9.2 21.4 and a Complete the ANOVA table for Exercise 9.1 How many degrees of freedom are associated with the F stati b stic for testing Ho : μ c...
Assume that both populations are normally distributed
 Assume that both populations are normally distributed(a) Test whether μ1 ≠ μ2 at the α=0.05 level of significance for the given sample data(b) Construct a 95 % confidence interval about μ1-μ2.(a) Test whether μ1 ≠ P2 at the α=0.05 level of significance for the given sample data. Determine the null and alternative hypothesis for this test.Determine the P-value for this hypothesis test.P=_______ (Round to threes decimal places as needed.)Should the null hypothesis be rejected?A. Reject H0, there is not sufficient...
(1 point) In order to compare the means of two populations, independent random samples of 271...
 (1 point) In order to compare the means of two populations, independent random samples of 271 observations are selected from each population, with the following results: Sample 1 Sample 2 1145 2 120 (a) Use a 99 % confidence interval to estimate the difference between the population means (A-μ). (b) Test the null hypothesis: HO : (μί-12-0 versus the alternative hypothesis. Ha : (μ-μ2)メ (i) the test statistic z () the positive critical z score (ii) the negative critical z...
 In order to compare the means of two populations, independent random samples of 395 observations are selected from each population, with the results found in the table to the right. Complete parts a through e below. Sample 2 x2 = 5,250 2-210 Sample 1 X,5,279 1-140 a. Use a 95% confidence interval to estimate the difference between the population means (μ1-μ2) . Interpret the confidence The confidence interval is Round to one decimal place as needed.) Interpret the confidence interval....
 Independent random samples selected from two normal populations produced the sample means and standard dev atons shown to the right. a. Assuming equal variances, conduct the test Ho: (μι-μ2)-U against Ha: μι-μ2) #0 using α .10. b. Find and interpret the 90% confidence interval for(μ1-μ2) Sample 1 Sample 2 x1 59 x2-7.9 13 2-4.8 a. Find the trst statistic. The test statistic is Round to two decimal places as needed.) ind the p vaue. The p-value is Round to three...
 The information below is based on independent random samples taken from two normally distributed populations having equal variances. Based on the sample information, determine the 95% confidence interval estimate for the difference between the two population means. n1 14 x145 n2 13 2 47 The 95% confidence interval is s (μ1-12) s Round to two decimal places as needed)
 9.1 Suppose that you wish to compare the means of six samples, each of which contains ten observations. Insert in an ANOVA table the sources of variation and their respective degrees of freedom. The values of Total SS and SSE for the experiment in Exercise 9.1 are Total SS SSE-16.2 9.2 21.4 and a Complete the ANOVA table for Exercise 9.1 How many degrees of freedom are associated with the F stati b stic for testing Ho : μ c...
 Assume that both populations are normally distributed(a) Test whether μ1 ≠ μ2 at the α=0.05 level of significance for the given sample data(b) Construct a 95 % confidence interval about μ1-μ2.(a) Test whether μ1 ≠ P2 at the α=0.05 level of significance for the given sample data. Determine the null and alternative hypothesis for this test.Determine the P-value for this hypothesis test.P=_______ (Round to threes decimal places as needed.)Should the null hypothesis be rejected?A. Reject H0, there is not sufficient...
 (1 point) In order to compare the means of two populations, independent random samples of 271 observations are selected from each population, with the following results: Sample 1 Sample 2 1145 2 120 (a) Use a 99 % confidence interval to estimate the difference between the population means (A-μ). (b) Test the null hypothesis: HO : (μί-12-0 versus the alternative hypothesis. Ha : (μ-μ2)メ (i) the test statistic z () the positive critical z score (ii) the negative critical z...
Most questions answered within 3 hours.
-
The average length of time between arrivals at a turnpike
toll-booth is 26 seconds. What is...
asked 51 minutes ago -
(a) A piston at 6.1 atm contains a gas that occupies a volume of
3.5 L....
asked 2 hours ago -
Please answer true or false. Words
cannot be changed or added in to make it true...
asked 2 hours ago -
An empty test tube weighs 15.923 grams. Then,
MgCl2•6H2O is added into the test tube. After...
asked 2 hours ago -
Assume memory access is 10 units of time and disk access is
10000 units of time....
asked 2 hours ago -
1. Are all good samples random?
2. Magazines often report surveys giving statistics such as “63%...
asked 2 hours ago -
Under all the various types of market structures, firms
must eventually earn some economic profits for...
asked 2 hours ago -
Consider the following fitness regime for a single locus trait
with two co-dominant alleles: w11 =...
asked 2 hours ago -
A large cable company reports the following.
80% of its customers subscribe to its cable TV...
asked 2 hours ago -
Please answer the question in brief.
Discuss the role of ERP in organizations. Are ERP tools...
asked 2 hours ago -
Discuss the pros and cons of collaborative software such
as SameTime. Does it increase productivity? What...
asked 2 hours ago -
Buying your in-laws a gift because it’s expected is
due to the ____________ motive of gift-giving....
asked 2 hours ago