In order to compare the means of two populations, independent random samples of 400 observations are...
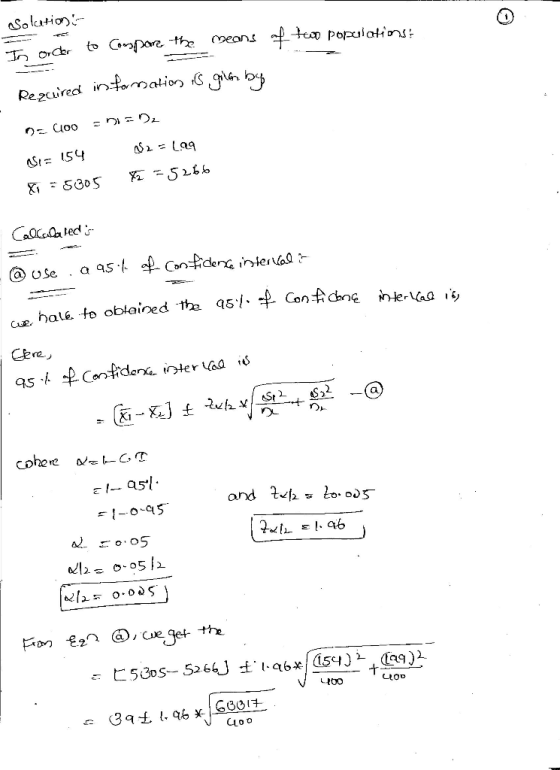
In order to compare the means of two populations, independent random samples of 400 observations are selected from each population, with the results found in the table to the right. Complete parts a through e below.
Sample 1
overbar x = 5,305
s1= 154
Sample 2
overbar x = 5,266
s2 = 199
a. Use a 95% confidence interval to estimate the difference between the population means (mu 1 - mu 2). Interpret the confidence interval.
The confidence interval is (__,__).
(Round to one decimal place as needed.)
Interpret the confidence interval. Select the correct answer below.
A. We are 95% confident that each of the population means falls outside of the confidence interval.
B. We are 95% confident that the difference between the population means falls outside of the confidence interval.
C. We are 95% confident that each of the population means is contained in the confidence interval.
D. We are 95% confident that the difference between the population means falls in the confidence interval.
b. Test the null hypothesis H0: (μ1−μ2) =0 versus the alternative hypothesis Ha: μ1−μ2≠0.
Give the significance level of the test, and interpret the result. Use alphaα=0.05.
What is the test statistic?
z = __ (Round 2 decimal places)
What is the observed significance level, or p-value?
p-value = __ (Round 3 decimal places)
Interpret the results. Choose the correct answer below.
A. Do not reject H0. There is not sufficient evidence that the population means are different.
B.Do not reject H0. There is sufficient evidence that the population means are different.
C.Reject H0. There is sufficient evidence that the population means are different.
D.Reject H0. There is not sufficient evidence that the population means are different.
c. Suppose the test in part b was conducted with the alternative hypothesis Ha: μ1−μ2>0. How would your answer to part b change? Select the correct choice below and fill in the answer box within your choice. (Round to three decimal places)
A. The test statistic would be ___, and the null hypothesis would not be rejected in favor of the new alternative hypothesis.
B. The observed significance level, or p-value, would be ___, and the null hypothesis would be rejected in favor of the new alternative hypothesis.
C. The observed significance level, or p-value, would be ___, and the null hypothesis would not be rejected in favor of the new alternative hypothesis.
D. The test statistic would be ___, and the null hypothesis would be rejected in favor of the new alternative hypothesis.
d. Test the null hypothesis H0: μ1−μ2=27 versus Ha: μ1−μ2≠27. Give the significance level and interpret the result. Use α=0.05. Compare your answer to the test conducted in part b.
What is the test statistic?
z = ___ (round two decimal places)
What is the observed significance level, or p-value?
p-value = ___ (Round 3 decimal places)
Interpret the results. Choose the correct answer below.
A. Reject H0. There is sufficient evidence to conclude that (μ1−μ2) is not equal to 27.
B. Do not reject H0. There is sufficient evidence to conclude that (μ1−μ2) is not equal to 27.
C. Reject H0. There is not sufficient evidence to conclude that (μ1−μ2) is not equal to 27.
D. Do not reject H0. There is not sufficient evidence to conclude that (μ1−μ2) is not equal to 27.
Compare your answer to the test conducted in part b. Choose the correct answer below.
A. The test in part b supported the hypothesis that the means are not different. The test in part d supported the hypothesis that the difference is 27.
B.The test in part b supported the hypothesis that the means are different. The test in part d supported the hypothesis that the difference is not
27.
C.The test in part b supported the hypothesis that the means are not different. The test in part d supported the hypothesis that the difference is not 27.
D.The test in part b supported the hypothesis that the means are different. The test in part d supported the hypothesis that the difference is
27.
e. What assumptions are necessary to ensure the validity of the inferential procedures applied in parts a-d?
A. One must assume that the two samples are small.
B. One must assume that the two samples are dependent random samples.
C. One must assume that the two samples are independent random samples.
D. One must assume that the z-distribution is approximately normal.
Homework Answers


 As per HomeworkLib rule , i will
answer only 4 questions .please send the last question separately ,
i will answer it .
As per HomeworkLib rule , i will
answer only 4 questions .please send the last question separately ,
i will answer it .
Thank you !
Add Answer to:
In order to compare the means of two populations, independent
random samples of 400 observations are...
In order to compare the means of two populations, independent random samples of 395 observations are...
 In order to compare the means of two populations, independent random samples of 395 observations are selected from each population, with the results found in the table to the right. Complete parts a through e below. Sample 2 x2 = 5,250 2-210 Sample 1 X,5,279 1-140 a. Use a 95% confidence interval to estimate the difference between the population means (μ1-μ2) . Interpret the confidence The confidence interval is Round to one decimal place as needed.) Interpret the confidence interval....
(1 point) In order to compare the means of two populations, independent random samples of 271...
 (1 point) In order to compare the means of two populations, independent random samples of 271 observations are selected from each population, with the following results: Sample 1 Sample 2 1145 2 120 (a) Use a 99 % confidence interval to estimate the difference between the population means (A-μ). (b) Test the null hypothesis: HO : (μί-12-0 versus the alternative hypothesis. Ha : (μ-μ2)メ (i) the test statistic z () the positive critical z score (ii) the negative critical z...
In order to compare the means of two populations, independent random samples of 385 observations are...
In order to compare the means of two populations, independent random samples of 385 observations are selected from each population, with the results found in the table to the right. Complete parts a through e. Sample 1 Sample 2 X1 = 5,337 X2 = 5,298 s1 = 157 s2 = 191 a. use a 95% confidence interval to estimate the difference between the population means (u1 - u2). Interpret the confidence interval. b. test the null hypothesis H0: (u1 - u2)...
In order to compare the means of two populations, independent random samples of 220 observations are...
In order to compare the means of two populations, independent random samples of 220 observations are selected from each population, with the following results: Sample 1 Sample 2 ?⎯⎯⎯1=0 ?⎯⎯⎯2=5 ?1=165 ?2=200 (a) Use a 97 % confidence interval to estimate the difference between the population means (?1−?2). ≤(?1−?2)≤ (b) Test the null hypothesis: ?0:(?1−?2)=0 versus the alternative hypothesis: ??:(?1−?2)≠0. Using ?=0.03, give the following: the test statistic ?= The final conclusion is: A. There is not sufficient evidence to...
Assume that both populations are normally distributed
 Assume that both populations are normally distributed(a) Test whether μ1 ≠ μ2 at the α=0.05 level of significance for the given sample data(b) Construct a 95 % confidence interval about μ1-μ2.(a) Test whether μ1 ≠ P2 at the α=0.05 level of significance for the given sample data. Determine the null and alternative hypothesis for this test.Determine the P-value for this hypothesis test.P=_______ (Round to threes decimal places as needed.)Should the null hypothesis be rejected?A. Reject H0, there is not sufficient...
in order to compare the means of two populations, independent random samples of 400 observations are...
in order to compare the means of two populations, independent random samples of 400 observations are selected from each population with the results: sample 1: x1= 5275 and s1= 150 sample 2: x2= 5240 and s2 = 200 a. use a 95% confidence interval to estimate the difference between the population means (m1-m2) interpret the difference. b. test the null hypothesis (m1-m2 = 0) versus the alternative (m1-m2 isn't = to 0). give the p-value of the test and interpret...
Assume that both populations are normally distributed. (a) Test whether μ1≠μ2 at the α=0.01 level of...
Assume that both populations are normally distributed. (a) Test whether μ1≠μ2 at the α=0.01 level of significance for the given sample data. (b) Construct a 9999% confidence interval about 1−μ2. Population 1 Population 2 n 10 10 x overbarx 10.1 8.9 s 2.4 2.3 (a) Test whether μ1≠μ2 at the α=0.01 level of significance for the given sample data. Determine the null and alternative hypothesis for this test. Detemine the P-value for this hypothesis test. P=________. (Round to three decimal...
9.6 in order to compare the means of two populations, inde- NW pendent random samples of 400 observations are selected from each population, with the following results Sample 1 Sample 2 $.240 s2 200...
 9.6 in order to compare the means of two populations, inde- NW pendent random samples of 400 observations are selected from each population, with the following results Sample 1 Sample 2 $.240 s2 200 5,275 1150 a. Use a 95% confidence interval to estimate the dif- ference between the population means (μ,-μ Interpret the confidence interval. b. Test the null hypothesis Ho (μι-μ)--0 versus the c. Suppose the test in part b were conducted with the d. Test thenull hypothesis...
Given in the table are the BMI statistics for random samples of men and women. Assume...
Given in the table are the BMI statistics for random samples of men and women. Assume that the two samples are independent simple random samples selected from normally distributed populations, and do not assume that the population standard deviations are equal. Complete parts (a) and (b) below. Use a 0.01 significance level for both parts. Male BMI Female BMI μ μ1 μ2 n 45 45 x 27.3958 24.7599 s 7.837628 4.750044 a. Test the claim that males and females have...
(1 point) In order to compare the means of two populations, independent random samples of 202...
 (1 point) In order to compare the means of two populations, independent random samples of 202 observations are selected from each population, with the following results: Sample 1 Sample 2 x1 = 4 x2 = 1 $1 = 105 s2 = 150 (a) Use a 90 % confidence interval to estimate the difference between the population means (41-42). < (41 - M2) (b) Test the null hypothesis: Ho : (41 - H2) = 0 versus the alternative hypothesis: H:(W1 -...
 In order to compare the means of two populations, independent random samples of 395 observations are selected from each population, with the results found in the table to the right. Complete parts a through e below. Sample 2 x2 = 5,250 2-210 Sample 1 X,5,279 1-140 a. Use a 95% confidence interval to estimate the difference between the population means (μ1-μ2) . Interpret the confidence The confidence interval is Round to one decimal place as needed.) Interpret the confidence interval....
 (1 point) In order to compare the means of two populations, independent random samples of 271 observations are selected from each population, with the following results: Sample 1 Sample 2 1145 2 120 (a) Use a 99 % confidence interval to estimate the difference between the population means (A-μ). (b) Test the null hypothesis: HO : (μί-12-0 versus the alternative hypothesis. Ha : (μ-μ2)メ (i) the test statistic z () the positive critical z score (ii) the negative critical z...
 Assume that both populations are normally distributed(a) Test whether μ1 ≠ μ2 at the α=0.05 level of significance for the given sample data(b) Construct a 95 % confidence interval about μ1-μ2.(a) Test whether μ1 ≠ P2 at the α=0.05 level of significance for the given sample data. Determine the null and alternative hypothesis for this test.Determine the P-value for this hypothesis test.P=_______ (Round to threes decimal places as needed.)Should the null hypothesis be rejected?A. Reject H0, there is not sufficient...
 9.6 in order to compare the means of two populations, inde- NW pendent random samples of 400 observations are selected from each population, with the following results Sample 1 Sample 2 $.240 s2 200 5,275 1150 a. Use a 95% confidence interval to estimate the dif- ference between the population means (μ,-μ Interpret the confidence interval. b. Test the null hypothesis Ho (μι-μ)--0 versus the c. Suppose the test in part b were conducted with the d. Test thenull hypothesis...
 (1 point) In order to compare the means of two populations, independent random samples of 202 observations are selected from each population, with the following results: Sample 1 Sample 2 x1 = 4 x2 = 1 $1 = 105 s2 = 150 (a) Use a 90 % confidence interval to estimate the difference between the population means (41-42). < (41 - M2) (b) Test the null hypothesis: Ho : (41 - H2) = 0 versus the alternative hypothesis: H:(W1 -...
Most questions answered within 3 hours.
-
From the literature (reference your sources): What are the
lattice parameters of calcite and aragonite? Why...
asked 27 minutes ago -
Your system is rejecting the question am asking which is
preceded by a case study. It...
asked 32 minutes ago -
3. On January 2, 2000, Larry creates a trust with himself as
trustee. Larry as trustee...
asked 29 minutes ago -
A member of the volleyball team spikes the ball. During this
process, she changes the velocity...
asked 36 minutes ago -
Are adult gamers less likely to use a gaming console (Xbox,
PlayStation, Wii, etc...) than teen...
asked 1 hour ago -
The University of
Texas recently reported that 43% of college students aged 18-24
would spend their...
asked 1 hour ago -
The length of stay at a specific emergency department in
Phoenix, Arizona, in 2009 had a...
asked 56 minutes ago -
. Please give the mechanism for this type of problem. Step by
Step
The toxin that...
asked 59 minutes ago -
If you have a 1M stock solution and you want to dilute 1 :10
with water,...
asked 1 hour ago -
In a load instruction, the effective address is obtained by
A) Retriving the address from a...
asked 1 hour ago -
Use the following information to answer this question.
Windswept, Inc. 2017 Income Statement ($ in millions)...
asked 1 hour ago -
A mutual fund salesperson has arranged to call on four people
tomorrow. Based on past experience...
asked 1 hour ago