
Homework Answers
a.
Linear Trend model for Share Price:
The linear trend equation format:
y = a + bx
where y = share price at a time period x
x = time period
a = intercept
b = slope of the trend line
Determining values of a and b using Least Square Method:
| Year(x) | Share Price (y) | xy | x^2 | |
| 1 | 14.75 | 14.75 | 1 | |
| 2 | 15.06 | 30.12 | 4 | |
| 3 | 14.98 | 44.94 | 9 | |
| 4 | 15.73 | 62.92 | 16 | |
| 5 | 16.11 | 80.55 | 25 | |
| 6 | 16.07 | 96.42 | 36 | |
| 7 | 16.78 | 117.46 | 49 | |
| 8 | 17.69 | 141.52 | 64 | |
| 9 | 16.9 | 152.1 | 81 | |
| 10 | 17.81 | 178.1 | 100 | |
| 11 | 19.08 | 209.88 | 121 | |
| 66 | 180.96 | 1128.76 | 506 | Total |
xy is x*y
X^2 is the squared value of x
x̄ = ∑x /n = 66/11 = 6
ȳ = ∑y/n = 180.96/11 = 16.45
b = (∑xy – nx̄ȳ) / (∑(x^2)-n (x̄^2)) = (1128.76-11*6*16.45)/(506-11*6^2) = 0.39
a = ȳ - b x̄ = 16.45-0.391*6 = 14.1
trend line equation:
y = 14.1 + 0.39x
forecast for the 12th year = 14.1+0.39*12 = 18.78
Forecast for shareprice for year 12 is 18.78
Excel Formula

b.
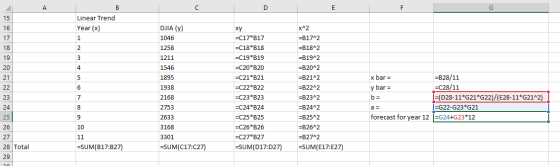
Linear Trend Model for DJIA:
Equation is y = a + bx
where y = DJIA
and x = time period
a and b represent the same as before
Determining values of a and b using Least Square Method:
| Year(x) | DJIA (y) | xy | x^2 | |
| 1 | 1046 | 1046 | 1 | |
| 2 | 1258 | 2516 | 4 | |
| 3 | 1211 | 3633 | 9 | |
| 4 | 1546 | 6184 | 16 | |
| 5 | 1895 | 9475 | 25 | |
| 6 | 1938 | 11628 | 36 | |
| 7 | 2168 | 15176 | 49 | |
| 8 | 2753 | 22024 | 64 | |
| 9 | 2633 | 23697 | 81 | |
| 10 | 3168 | 31680 | 100 | |
| 11 | 3301 | 36311 | 121 | |
| 66 | 22917 | 163370 | 506 | Total |
The linear trendline equation format is as mentioned above.
x̄ = ∑x /n = 66/11 = 6
ȳ = ∑y/n = 22917/11 = 2083.36
b = (∑xy – nx̄ȳ) / (∑(x^2)-n (x̄^2)) = (163370-11*6*2083.364)/(506-11*6^2) = 235.16
a = ȳ - b x̄ = 2083.364-235.163*6 = 672.4
trend line equation:
y = 672.4 + 235.16x
forecast for the 12th year = 672.4 + 235.16*12 = 3494.3
Forecast for DJIA for year 12 is 3494
Excel Formula
c.
Regression model to forecast DJIA using share price.
As the DJIA is to be determined as the function of share price,
Share Price is independent variable, x
DJIA is the dependent variable y
The regression equation is similar to that of the trend line as determined in above questions and the value of a and b can be determined using the least square method.
Equation is y = a + bx
where y = DJIA
and x =share price
a and b represent the same as before
Least Square Method:
| Year | Share Price (x) | DJIA (y) | xy | x^2 |
| 1 | 14.75 | 1046 | 15428.5 | 217.5625 |
| 2 | 15.06 | 1258 | 18945.48 | 226.8036 |
| 3 | 14.98 | 1211 | 18140.78 | 224.4004 |
| 4 | 15.73 | 1546 | 24318.58 | 247.4329 |
| 5 | 16.11 | 1895 | 30528.45 | 259.5321 |
| 6 | 16.07 | 1938 | 31143.66 | 258.2449 |
| 7 | 16.78 | 2168 | 36379.04 | 281.5684 |
| 8 | 17.69 | 2753 | 48700.57 | 312.9361 |
| 9 | 16.9 | 2633 | 44497.7 | 285.61 |
| 10 | 17.81 | 3168 | 56422.08 | 317.1961 |
| 11 | 19.08 | 3301 | 62983.08 | 364.0464 |
| Total | 180.96 | 22917 | 387487.9 | 2995.333 |
x̄ = ∑x /n = 180.96/11 =
16.45091
ȳ = ∑y/n = 22917/11 = 2083.364
b = (∑xy – nx̄ȳ) / (∑(x^2)-n (x̄^2)) = (387487.9-11*16.45091*2083.364)/(2995.333-11*16.45091^2) = 570.43
a = ȳ - b x̄ = 2083.364-570.43*16.45091 = -7300.7
Regression model equation:
y = (-7300.7)+570.43x
the value of share price for 12th year as calculated in a is 18.78
forecast for the 12th year = (-7300.7)+570.43*18.78 = 3411.98
Excel Formula

d.
MAD and MAPD for the forecasts calculated in b and c
MAD and MAPD for Regression Model:
| Year | Share Price | DJIA | Regression Forecast | Absolute Deviation |
| 1 | 14.75 | 1046 | 1113.143 | 67.1425 |
| 2 | 15.06 | 1258 | 1289.976 | 31.9758 |
| 3 | 14.98 | 1211 | 1244.341 | 33.3414 |
| 4 | 15.73 | 1546 | 1672.164 | 126.1639 |
| 5 | 16.11 | 1895 | 1888.927 | 6.0727 |
| 6 | 16.07 | 1938 | 1866.11 | 71.8899 |
| 7 | 16.78 | 2168 | 2271.115 | 103.1154 |
| 8 | 17.69 | 2753 | 2790.207 | 37.2067 |
| 9 | 16.9 | 2633 | 2339.567 | 293.433 |
| 10 | 17.81 | 3168 | 2858.658 | 309.3417 |
| 11 | 19.08 | 3301 | 3583.104 | 282.1044 |
| Total | 22917 | MAD | 123.7989 | |
| MAPD | 0.059423 |
The forecast values are calculated by replacing the value of x in the regression equation (derived in c) with the values of the corresponding share price.
MAD = Mean Absolute Deviation = Average of Absolute Deviation values
MAPD = Mean Absolute Percentage Deviation = Sum of Absolute Deviations/Sum of Actual DJIA
Excel Formulas:

MAD and MAPD for Linear Trend Model:
| Year | Share Price | DJIA | Linear Trend Forecast | Absolute Deviation |
| 1 | 14.75 | 1046 | 907.56 | 138.44 |
| 2 | 15.06 | 1258 | 1142.72 | 115.28 |
| 3 | 14.98 | 1211 | 1377.88 | 166.88 |
| 4 | 15.73 | 1546 | 1613.04 | 67.04 |
| 5 | 16.11 | 1895 | 1848.2 | 46.8 |
| 6 | 16.07 | 1938 | 2083.36 | 145.36 |
| 7 | 16.78 | 2168 | 2318.52 | 150.52 |
| 8 | 17.69 | 2753 | 2553.68 | 199.32 |
| 9 | 16.9 | 2633 | 2788.84 | 155.84 |
| 10 | 17.81 | 3168 | 3024 | 144 |
| 11 | 19.08 | 3301 | 3259.16 | 41.84 |
| Total | 22917 | MAD | 124.6655 | |
| MAPD | 0.059839 |
The forecast values are calculated by replacing the values of x in the trend line equation (derived in b) with the corresponding time period values.
Excel Formulas

Though the MAD and MAPD values are very close for both of the forecast models, both the values of regression model are lower as compared to the linear trend model. Hence the regression model is more accurate.
Add Answer to:
Answer using excel
The Wellton Fund is a balanced mutual fund that includes a mix of...
Most questions answered within 3 hours.
-
a) Draw two water molecules.
b) Clearly name and label the type of bond that exists...
asked 40 minutes ago -
C - Language
Write a loop that sets each array element to the sum of itself...
asked 1 hour ago -
(63
#14)
which of the following statments best describes how chamging
the concentration of the substances...
asked 5 hours ago -
In the following reaction, which element is undergoing
oxidation: Na2SO3 + N2O --> N2 + Na2SO4...
asked 6 hours ago -
Which of the following pairs of ions have the same electron
configuration?
I: Br− and Se2−...
asked 8 hours ago -
The Foremost Composite Materials Company is planning a two-day
sales conference for October 19-20. The conference...
asked 9 hours ago -
3) Illustrate the observed pattern of relatedness of organisms
versus adaptations to specific conditions. This means...
asked 9 hours ago -
In winter a lake has a 0.35 m thick ice layer over 1.10 m of
water....
asked 10 hours ago -
Assuming the following has been encrypted with a Vigenere cipher
below, use the method(s) and assumptions...
asked 10 hours ago -
How would I use switch statements to write a program that will
take an input of...
asked 10 hours ago -
Imagine a reaction in which methane gas combusts at a constant
pressure of 1 atm and...
asked 10 hours ago -
Two parallel wires (each 12 m in length) are separated by a
distance of 0.065 m...
asked 10 hours ago