
Homework Answers
I) Looking at the full model, the independent variable fatheduc is a significant variable as the p- value <0.05 (0.003), we can safely reject the null hypothesis that says no association exist. The coefficient is 0.004, we can conclude that every one unit increase in fatheduc, there is 0.004 increase in the dependent variable bwght, However the coefficient of determination i.e adjusted R^2, is the same in the full model and the reduced model, that explains how the model improves with every new addition in the variable, so again it depends on the researched whether to include this new variable or not, also F statistics can be studied to take a thorough decision.
ii) we basically have the full model to check if the additional Betas does any value addition to check the association between y and the predictors.
To compute the F statistic , we firstly have to fit both the reduced model and then the complete model and then get the values for SSE for the reduced model and the SSE for the complete model. And then at a certain level of alpha, we compare the F−statistic to an Fν1,ν2 from F table, where ν1 = p and ν2 = n − (k + p + 1)
In the formula given above , q = no of additional betas
k = no of parameters in the reduced model ( k+ p in the full model)
n = no of observations
Once we have the value from the F table, we can decide to accept or reject the Null Hypothesis
If F ≥ Fα,ν1,ν2 , reject H0 [Hypotheses: H0 : βk+1 = βk+2 = ... = βk+p = 0 versus Ha : At least one β not equal to 0]
To compute the F statistics, we would require all the individual observations for the reduced (n = 1388) as well for the full (n = 1191) model, then once we calculate the mean value, we can calculate the deviation of individual values from the mean, then square the deviation, and then add all the deviation^2 ( for 1388 ) , likewise for 1191 values . this is the SSE value.
Else, if we had known the S.D value then using the below formula SSE could have been calculated as we know the n.

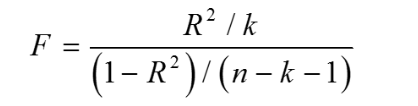
We can still calculate F statistics with the help of R^2 value, but for an individual model not for a nested model.
Thanks,
Add Answer to:
1. (5 marks) The following equations were estimated using the data in “bwght": bwght=4.682 -0.005cigs, +0.155parity;+0.026male;+0.062white;...
Please answer questions 4 and 5 only !!! thank you the data from quest 3 is:...
 Please answer questions 4 and 5 only !!!
thank you
the data from quest 3 is:
P-values (0.00) (0.00) P-value for F = 0.00 a) Interpret the intercept and the clope Show the estimated regression equation in a diagram b) Interpret the value of R Tos-1.0476810 4. Refer to the regression results in question 3. a) Examine, based on the p-value, whether the slope (ba) is statistically significant at the 5% level. Mention all the steps. HB (2Sinbad level ...5...
Please answer questions 4 and 5 only !!!
thank you
the data from quest 3 is:
P-values (0.00) (0.00) P-value for F = 0.00 a) Interpret the intercept and the clope Show the estimated regression equation in a diagram b) Interpret the value of R Tos-1.0476810 4. Refer to the regression results in question 3. a) Examine, based on the p-value, whether the slope (ba) is statistically significant at the 5% level. Mention all the steps. HB (2Sinbad level ...5...
The exercise involving data in this and subsequent sections were designed to be solved using Excel....
 The exercise involving data in this and subsequent sections were designed to be solved using Excel. The following estimated regression equation is based on 10 observations was presented. $ = 29.1270 + 0.590621 +0.498022 Here SST = 6,943.875, SSR = 6,696.375, 85, = 0.0752, and 86 = 0.0513. a. Compute MSR and MSE (to 3 decimals). MSR 3348.188 MSE 35.337 b. Compute the F test statistic (to 2 decimals). Use F table. 94.72 ♡ What is the p-value? less than...
The exercise involving data in this and subsequent sections were designed to be solved using Excel. The following estim...
 The exercise involving data in this and subsequent sections were designed to be solved using Excel. The following estimated regression equation is based on 10 observations was presented. y = 29.1270 +0.5906x1 +0.4980x2 Here SST = 6,614.875, SSR = 6,040.125, Sbı = 0.0812, and Sba = 0.0696. a. Compute MSR and MSE (to 3 decimals). MSR 3020.063 MSE 82.107 b. Compute the F test statistic (to 2 decimals). Use F table. 36.78 What is the p-value? less than .01 At...
The exercise involving data in this and subsequent sections were designed to be solved using Excel. The following estim...
 The exercise involving data in this and subsequent sections were designed to be solved using Excel. The following estimated regression equation is based on 10 observations was presented. y = 29.1270+ 0.5906x1 +0.4980:02 Here SST = 6,894.875, SSR = 6,237.875, Sby = 0.0777, and $by = 0.0667 a. Compute MSR and MSE (to 3 decimals). MSR 3118.938 MSE 93.857 b. Compute the F test statistic (to 2 decimals). Use F table. 33.23 What is the p-value? less than .01 than...
In this exercise use the Peruvian blood pressure data set, provided in the file peruvian.txt. Thi...
 In this exercise use the Peruvian blood pressure data set,
provided in the file peruvian.txt. This dataset consists of
variables possibly relating to blood pressures of n = 39 Peruvians
who have moved from rural high altitude areas to urban lower
altitude areas. The variables in this dataset are: Age, Years,
Weight, Height, Calf, Pulse, Systol and Diastol. Before reading the
data intoMATLAB, it can be viewed in a text editor.
This question involves the use of multiple linear regression...
In this exercise use the Peruvian blood pressure data set,
provided in the file peruvian.txt. This dataset consists of
variables possibly relating to blood pressures of n = 39 Peruvians
who have moved from rural high altitude areas to urban lower
altitude areas. The variables in this dataset are: Age, Years,
Weight, Height, Calf, Pulse, Systol and Diastol. Before reading the
data intoMATLAB, it can be viewed in a text editor.
This question involves the use of multiple linear regression...
(***Round all the answers and intermediate calculations to two decimal places***) Question 1 (50 Marks) The...
 (***Round all the answers and intermediate calculations to two decimal places***) Question 1 (50 Marks) The marketing manager of a local convenience store chain is conducting an investigation of the price effects of Brand A (P) and its competitor (Ps) on the quantity sold of Brand A beer in year 2016. The following model has been estimated: Sale_4 - Be + B,PA+BP3 + e for a sample of 52 weekly observations. Sale 4: number of bottles of Brand A sold...
just anw the c part thx Question 1 (100 Marks) The following table is the regression...
 just anw the c part thx
Question 1 (100 Marks) The following table is the regression results from the econometric model: LOG(SALES) = B. + B2LOG (PRICE) + BzADVERT + e For a sample of 66 observations. SALES: Monthly Sales of product A ($1000) PRICE: A price Index of product A (SI) ADVERT: Adverting Expenditure on product A (S1000) Dependent Variable: LOGSALES Method: Least Squares Date:03/19/20 Time: 20:04 Included observations: 66 Variable Coefficient Std. Error -Statistic Prob. LOGPRICE ADVERT 5.325153...
just anw the c part thx
Question 1 (100 Marks) The following table is the regression results from the econometric model: LOG(SALES) = B. + B2LOG (PRICE) + BzADVERT + e For a sample of 66 observations. SALES: Monthly Sales of product A ($1000) PRICE: A price Index of product A (SI) ADVERT: Adverting Expenditure on product A (S1000) Dependent Variable: LOGSALES Method: Least Squares Date:03/19/20 Time: 20:04 Included observations: 66 Variable Coefficient Std. Error -Statistic Prob. LOGPRICE ADVERT 5.325153...
3. Compare the fits of Equations 26 and 27 using the F-test. If the two equations are significantly different in o...
 3. Compare the fits of Equations 26 and 27 using the F-test. If the two equations are significantly different in overall fit, we can conclude that it's likely that Equation 26 is misspecified While the Ramsey RESET test is fairly easy to use, it does little more than signal when a major specification error might exist. If you encounter a sig nificant Ramsey RESET test, then you face the daunting task of figuring out exactly what the error is! Thus,...
Hello, Q1: where does the f(1,17) the 1 come from? Q2, how do i get the...
 Hello,
Q1: where does the f(1,17) the 1 come from?
Q2, how do i get the second equation from the first
equation?
thanks
Heat treating is often used to carburize metal parts such as gears. The thickness of the carburized layer is considered an important feature of the gear, and it contributes to the overall reliability of the part. Because of the critical nature of this feature, a lab test is performed on each furnace load. The test is a...
Hello,
Q1: where does the f(1,17) the 1 come from?
Q2, how do i get the second equation from the first
equation?
thanks
Heat treating is often used to carburize metal parts such as gears. The thickness of the carburized layer is considered an important feature of the gear, and it contributes to the overall reliability of the part. Because of the critical nature of this feature, a lab test is performed on each furnace load. The test is a...
________________ ________________ ______________ 11. Using Excel - Scatter diagrams, estimated regression equations, and trendlines Suppose a...
 ________________
______________
11. Using Excel - Scatter diagrams, estimated regression equations, and trendlines Suppose a company records data on sales calls, induding the length of each call and whether a sale was made. The manager is interested in determining whether there is a relationship between the average time spent per call and the number of sales made by each employee, so she obtains the average call length and the total number of sales over a 2-week period for a...
________________
________________
______________
11. Using Excel - Scatter diagrams, estimated regression equations, and trendlines Suppose a company records data on sales calls, induding the length of each call and whether a sale was made. The manager is interested in determining whether there is a relationship between the average time spent per call and the number of sales made by each employee, so she obtains the average call length and the total number of sales over a 2-week period for a...
 Please answer questions 4 and 5 only !!!
thank you
the data from quest 3 is:
P-values (0.00) (0.00) P-value for F = 0.00 a) Interpret the intercept and the clope Show the estimated regression equation in a diagram b) Interpret the value of R Tos-1.0476810 4. Refer to the regression results in question 3. a) Examine, based on the p-value, whether the slope (ba) is statistically significant at the 5% level. Mention all the steps. HB (2Sinbad level ...5...
Please answer questions 4 and 5 only !!!
thank you
the data from quest 3 is:
P-values (0.00) (0.00) P-value for F = 0.00 a) Interpret the intercept and the clope Show the estimated regression equation in a diagram b) Interpret the value of R Tos-1.0476810 4. Refer to the regression results in question 3. a) Examine, based on the p-value, whether the slope (ba) is statistically significant at the 5% level. Mention all the steps. HB (2Sinbad level ...5...
 The exercise involving data in this and subsequent sections were designed to be solved using Excel. The following estimated regression equation is based on 10 observations was presented. $ = 29.1270 + 0.590621 +0.498022 Here SST = 6,943.875, SSR = 6,696.375, 85, = 0.0752, and 86 = 0.0513. a. Compute MSR and MSE (to 3 decimals). MSR 3348.188 MSE 35.337 b. Compute the F test statistic (to 2 decimals). Use F table. 94.72 ♡ What is the p-value? less than...
 The exercise involving data in this and subsequent sections were designed to be solved using Excel. The following estimated regression equation is based on 10 observations was presented. y = 29.1270 +0.5906x1 +0.4980x2 Here SST = 6,614.875, SSR = 6,040.125, Sbı = 0.0812, and Sba = 0.0696. a. Compute MSR and MSE (to 3 decimals). MSR 3020.063 MSE 82.107 b. Compute the F test statistic (to 2 decimals). Use F table. 36.78 What is the p-value? less than .01 At...
 The exercise involving data in this and subsequent sections were designed to be solved using Excel. The following estimated regression equation is based on 10 observations was presented. y = 29.1270+ 0.5906x1 +0.4980:02 Here SST = 6,894.875, SSR = 6,237.875, Sby = 0.0777, and $by = 0.0667 a. Compute MSR and MSE (to 3 decimals). MSR 3118.938 MSE 93.857 b. Compute the F test statistic (to 2 decimals). Use F table. 33.23 What is the p-value? less than .01 than...
 In this exercise use the Peruvian blood pressure data set,
provided in the file peruvian.txt. This dataset consists of
variables possibly relating to blood pressures of n = 39 Peruvians
who have moved from rural high altitude areas to urban lower
altitude areas. The variables in this dataset are: Age, Years,
Weight, Height, Calf, Pulse, Systol and Diastol. Before reading the
data intoMATLAB, it can be viewed in a text editor.
This question involves the use of multiple linear regression...
In this exercise use the Peruvian blood pressure data set,
provided in the file peruvian.txt. This dataset consists of
variables possibly relating to blood pressures of n = 39 Peruvians
who have moved from rural high altitude areas to urban lower
altitude areas. The variables in this dataset are: Age, Years,
Weight, Height, Calf, Pulse, Systol and Diastol. Before reading the
data intoMATLAB, it can be viewed in a text editor.
This question involves the use of multiple linear regression...
 (***Round all the answers and intermediate calculations to two decimal places***) Question 1 (50 Marks) The marketing manager of a local convenience store chain is conducting an investigation of the price effects of Brand A (P) and its competitor (Ps) on the quantity sold of Brand A beer in year 2016. The following model has been estimated: Sale_4 - Be + B,PA+BP3 + e for a sample of 52 weekly observations. Sale 4: number of bottles of Brand A sold...
 just anw the c part thx
Question 1 (100 Marks) The following table is the regression results from the econometric model: LOG(SALES) = B. + B2LOG (PRICE) + BzADVERT + e For a sample of 66 observations. SALES: Monthly Sales of product A ($1000) PRICE: A price Index of product A (SI) ADVERT: Adverting Expenditure on product A (S1000) Dependent Variable: LOGSALES Method: Least Squares Date:03/19/20 Time: 20:04 Included observations: 66 Variable Coefficient Std. Error -Statistic Prob. LOGPRICE ADVERT 5.325153...
just anw the c part thx
Question 1 (100 Marks) The following table is the regression results from the econometric model: LOG(SALES) = B. + B2LOG (PRICE) + BzADVERT + e For a sample of 66 observations. SALES: Monthly Sales of product A ($1000) PRICE: A price Index of product A (SI) ADVERT: Adverting Expenditure on product A (S1000) Dependent Variable: LOGSALES Method: Least Squares Date:03/19/20 Time: 20:04 Included observations: 66 Variable Coefficient Std. Error -Statistic Prob. LOGPRICE ADVERT 5.325153...
 3. Compare the fits of Equations 26 and 27 using the F-test. If the two equations are significantly different in overall fit, we can conclude that it's likely that Equation 26 is misspecified While the Ramsey RESET test is fairly easy to use, it does little more than signal when a major specification error might exist. If you encounter a sig nificant Ramsey RESET test, then you face the daunting task of figuring out exactly what the error is! Thus,...
 Hello,
Q1: where does the f(1,17) the 1 come from?
Q2, how do i get the second equation from the first
equation?
thanks
Heat treating is often used to carburize metal parts such as gears. The thickness of the carburized layer is considered an important feature of the gear, and it contributes to the overall reliability of the part. Because of the critical nature of this feature, a lab test is performed on each furnace load. The test is a...
Hello,
Q1: where does the f(1,17) the 1 come from?
Q2, how do i get the second equation from the first
equation?
thanks
Heat treating is often used to carburize metal parts such as gears. The thickness of the carburized layer is considered an important feature of the gear, and it contributes to the overall reliability of the part. Because of the critical nature of this feature, a lab test is performed on each furnace load. The test is a...
 ________________
______________
11. Using Excel - Scatter diagrams, estimated regression equations, and trendlines Suppose a company records data on sales calls, induding the length of each call and whether a sale was made. The manager is interested in determining whether there is a relationship between the average time spent per call and the number of sales made by each employee, so she obtains the average call length and the total number of sales over a 2-week period for a...
________________
________________
______________
11. Using Excel - Scatter diagrams, estimated regression equations, and trendlines Suppose a company records data on sales calls, induding the length of each call and whether a sale was made. The manager is interested in determining whether there is a relationship between the average time spent per call and the number of sales made by each employee, so she obtains the average call length and the total number of sales over a 2-week period for a...
Most questions answered within 3 hours.
-
The free energy change for the following reaction at 25 °C, when
[Sn2+] = 1.17 M...
asked 45 minutes ago -
An MNE is this kind of industry when competition in one country
is essentially independent of...
asked 2 hours ago -
. For this set of questions, determine what
proportion of a normal distribution is located betweeneach...
asked 2 hours ago -
A college student is employed as a door-to-door newspaper
salesman. Historical data suggests that the student...
asked 3 hours ago -
MATLAB HW 11 problem using Switch Case and Input commands
Write a script file that calculates...
asked 3 hours ago -
Considering gravitational time dilation, calculate the time that
passes in Earth’s surface while 1 hour passes...
asked 4 hours ago -
Minitab Problem: Take the Lake Hume June rainfall data and find
use the processes outlined in...
asked 5 hours ago -
X Company is trying to decide whether to continue using old
equipment to make Product A...
asked 5 hours ago -
IN PYTHON ONLY !! Program 2: Re-work
program #5 (WeeklyHours) from the previous assignment such that...
asked 5 hours ago -
The average length of time between arrivals at a turnpike
toll-booth is 26 seconds. What is...
asked 7 hours ago -
(a) A piston at 6.1 atm contains a gas that occupies a volume of
3.5 L....
asked 8 hours ago -
Please answer true or false. Words
cannot be changed or added in to make it true...
asked 8 hours ago