

Homework Answers
Let  be the true mean weekly earnings for females and
  be the true mean weekly earnings for males
Using this,

The hypotheses are

We have the following sample information

The standard error of the difference between 2 means is

The sample sizes are greater than 30 and hence using the central limit theorem, we can say that the sampling distribution of difference between 2 means is normally distributed.
95% confidence level corresponds to  level of significance
The right tail critical value is

Using the standard normal tables, we get for z=1.96, P(Z<1.96)=0.975
That is, 
The 95% confidence interval is

ans:
- The lower limit is $-55.68
- The upper limit is $11.10
This is a left tailed test (The alternative hypothesis has "<")
The right tail critical value for significance level 1%
( )
is
)
is
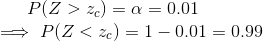
Using the standard normal tables, we get for z=2.33, P(Z<2.33)=0.99
The right tail critical value is 2.33. The left tail critical value is -2.33
ans:

The hypothesized value of difference between 2 means is

The test statistic is

ans: The value f the test statistic is -1.308
This is a left tailed test. The p-value is the area under the left tail
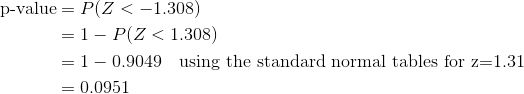
ans: The p-value for the test is 0.0951
Note: If we use technology using the unrounded -1.308, we get the p-value=0.0954
We will reject the null hypothesis, if the p-value is less than the significance level 0.01.
Here, the p-vale is 0.0951 and it is greater than 0.01. Hence we do not reject the null hypothesis.
We conclude that
Do not reject H0. There is no sufficient evidence to support the claim that mean weekly earnings for females is less than the mean weekly earnings for males
100-105
Let  be the true proportion of females satisfied with their jobs
and
be the true proportion of females satisfied with their jobs
and  be the true proportion of males satisfied with their jobs
The hypotheses are

We have the following sample information

The pooled sample proportion of job-holders satisfied with their jobs is

The standard error of difference between 2 proportions is

97% confidence level is  level of significance
The right tail critical value is

Using the standard normal tables, for z=2.17, we get P(Z<2.17)=0.985
Hence, 
The 97% confidence interval is

ans:
- The lower limit is -0.0962
- The upper limit is 0.0049
This is a left tailed test (The alternative hypothesis has "<")
The right tail critical value for significance level 2.5%
( )
is
)
is

Using the standard normal tables, we get for z=1.96, P(Z<1.96)=0.975
The right tail critical value is 1.96. The left tail critical value is -1.96
ans:

ans:
The value of the pooled sample proportion is 0.6405
The hypothesized value of the difference between 2 proportion is

The test statistic is

ans:
The value of the test statistic,z, is -1.958
We will reject the null hypothesis, if the test statistic is less than the critical value.
Here, the test statistic is -1.958 and it is not less than the critical value -1.96. Hence we do not reject the null hypothesis.
We conclude that
Do not reject H0. There is no sufficient evidence to support the claim that the proportion of female job holders who are satisfied with their jobs is less than the proportion of male job holders who are satisfied with their jobs
Add Answer to:
chapter 10 question 009-13
100-105
Chapter 10, Testbank, Question 009-013 A sample of S2 female workers...
According to a Louis Harris survey, 489 in a sample of 980 female drivers reported that...
According to a Louis Harris survey, 489 in a sample of 980 female drivers reported that they never speed, while 533 in a sample of 1170 male drivers report that they never speed. The null hypothesis is that the proportions of all female and male drivers who never speed are the same. The alternative hypothesis is that the proportion of female drivers who never speed is higher than the proportion of male drivers who never speed. The significance level is...
Do women feel differently from men when it comes to tax rates? One question on a...
 Do women feel differently from men when it comes to tax rates? One question on a survey of randomly selected adults asked, "What percent of income do you believe individuals should pay in income tax?" Complete parts a) through c). Click the icon to view the survey results. a) Draw side-by-side boxplots of tax rates by gender. Choose the correct graph below. Survey Results OA. ОВ. A 10 20 30 40 10 20 30 40 M Oc OD 40 40...
According to a Health of Boston report, female residents in Boston have a higher average life...
According to a Health of Boston report, female residents in Boston have a higher average life expectancy as compared to male residents (The Boston Globe, August 16, 2010). You collect the following sample data to verify the results of the report. You also use the historical (population) standard deviation of 8.2 years for females and 8.6 years for males. (You may find it useful to reference the appropriate table: z table or t table) Female Male −x1 = 81.1 −x2...
Does the amount of hazardous material absorbed by the bodies of hazardous waste workers depend on...
Does the amount of hazardous material absorbed by the bodies of hazardous waste workers depend on gender? You want to test the hypotheses that the amount absorbed by men (group 1) is different from the amount absorbed by women (group 2). A random sample of 167 male workers and 188 female workers showed an average lead absorption in the blood of 9.7 (SD = 0.975) and 9.62 (SD = 0.724), respectively (measured in micrograms/deciliter). Assuming that the population standard deviations...
Also what is the P value and do I reject the hypothesis v Do women feel...
 Also what is the P value and do I reject the hypothesis
v
Do women feel differently from men when it comes to tax rates? One question on a survey of randomly selected adults asked, "What percent of income do you believe individuals should pay in income tax?" Complete parts a) through c). B Click the icon to view the survey results. CYC. Each sample size is small relative to the size of its population. LYD. Each sample is obtained...
Also what is the P value and do I reject the hypothesis
v
Do women feel differently from men when it comes to tax rates? One question on a survey of randomly selected adults asked, "What percent of income do you believe individuals should pay in income tax?" Complete parts a) through c). B Click the icon to view the survey results. CYC. Each sample size is small relative to the size of its population. LYD. Each sample is obtained...
Each person in a random sample of 224 male teenagers and a random sample of 303...
Each person in a random sample of 224 male teenagers and a random sample of 303 female teenagers was asked how many hours he or she spent online in a typical week. The sample mean and standard deviation were 15.2 hours and 11.3 hours for males and 14.3 and 11.7 for females. (Use a statistical computer package to calculate the P-value. Use μmales − μfemales. Round your test statistic to two decimal places, your df down to the nearest whole...
QUESTION 5 Suppose that a researcher, using wage data on 250 randomly selected male workers and 2...
 QUESTION 5 Suppose that a researcher, using wage data on 250 randomly selected male workers and 280 female workers, estimates the OLS regression: Wage 12.52 + 2.12 x Male, R2 0.06, SER 4.2 (0.23) (0.36) where Wage is measured in dollars per hour and Male is a binary variable that is equal to 1 if the person is a male and O if the person is a female. Define the wage gender gap as the difference in the mean earnings...
Each person in a random sample of 225 male teenagers and a random sample of 301...
Each person in a random sample of 225 male teenagers and a random sample of 301 female teenagers was asked how many hours he or she spent online in a typical week. The sample mean and standard deviation were 15.3 hours and 11.3 hours for males and 14.1 and 11.8 for females. (Use a statistical computer package to calculate the P-value. Use μmales − μfemales. Round your test statistic to two decimal places, your df down to the nearest whole...
I want you to conduct a hypothesis test for a difference of means for cholesterol levels...
I want you to conduct a hypothesis test for a difference of means for cholesterol levels between male and female students. There are 148 females and 164 males in our sample. You can treat this as a large sample problem and use z-values for confidence intervals and hypothesis tests (however, Excel uses a t-value in anything it calculates). The output from Microsoft Excel is given below to help. Your job will be to find the right numbers in the output...
 Do women feel differently from men when it comes to tax rates? One question on a survey of randomly selected adults asked, "What percent of income do you believe individuals should pay in income tax?" Complete parts a) through c). Click the icon to view the survey results. a) Draw side-by-side boxplots of tax rates by gender. Choose the correct graph below. Survey Results OA. ОВ. A 10 20 30 40 10 20 30 40 M Oc OD 40 40...
 Also what is the P value and do I reject the hypothesis
v
Do women feel differently from men when it comes to tax rates? One question on a survey of randomly selected adults asked, "What percent of income do you believe individuals should pay in income tax?" Complete parts a) through c). B Click the icon to view the survey results. CYC. Each sample size is small relative to the size of its population. LYD. Each sample is obtained...
Also what is the P value and do I reject the hypothesis
v
Do women feel differently from men when it comes to tax rates? One question on a survey of randomly selected adults asked, "What percent of income do you believe individuals should pay in income tax?" Complete parts a) through c). B Click the icon to view the survey results. CYC. Each sample size is small relative to the size of its population. LYD. Each sample is obtained...
 QUESTION 5 Suppose that a researcher, using wage data on 250 randomly selected male workers and 280 female workers, estimates the OLS regression: Wage 12.52 + 2.12 x Male, R2 0.06, SER 4.2 (0.23) (0.36) where Wage is measured in dollars per hour and Male is a binary variable that is equal to 1 if the person is a male and O if the person is a female. Define the wage gender gap as the difference in the mean earnings...
Most questions answered within 3 hours.
-
A sine wave signal is displayed on the screen of an
oscilloscope. 6 peak-to-peak divisions are...
asked 13 minutes ago -
a
1500 kg car accelerates from 0 to 25 m / s in 21.0s. How much...
asked 1 hour ago -
Calculate the molarity of each of the following solutions:
(a) 30.5 g of ethanol (C2H5OH) in...
asked 1 hour ago -
1 Refer to the build-borrow-or-buy framework as a decision tree
for the Adidas company. Identify a...
asked 1 hour ago -
Problem 2: The Problem of Social Cost. A Rancher and Farmer live
side-by-side to each other....
asked 3 hours ago -
a uniform bar of weight 40N is 4 meter long. weights
on 60N and 100N are...
asked 2 hours ago -
Define Diet counceling? What are the
responsibilities of a counselor?
asked 4 hours ago -
Hey im just confused about how to put the ' A angle n' and ' S...
asked 4 hours ago -
A short essay about the WSJ article on Oreo versus Hydrox.
asked 4 hours ago -
##8. A program contains the following function definition:
##def cube(num):
##return num * num * num...
asked 4 hours ago -
find the value z of a standard Normal variable that satisfies
each of the given conditions....
asked 5 hours ago -
"banana".find('z')
Out[22]: -1
why is this -1
python 3.7
asked 4 hours ago