

Homework Answers

Add Answer to:
Suppose that Raphael and Susan are the only consumers of pizza slices in a particular market....
Suppose that Eric and Ginny are the only consumers of pizza slices in a particular market....
Suppose that Eric and Ginny are the only consumers of pizza slices in a particular market. The following table shows their annual demand schedules: Price Eric’s Quantity Demanded Ginny’s Quantity Demanded (Dollars per slice) (Slices) (Slices) 1 40 60 2 30 40 3 20 30 4 10 20 5 0 10 On the following graph, plot Eric’s demand for pizza slices using the green points (triangle symbol). Next, plot Ginny’s demand for pizza slices using the purple points (diamond symbol)....
3. Individual and market demand Suppose that Kevin and Maria are the only consumers of pizza...
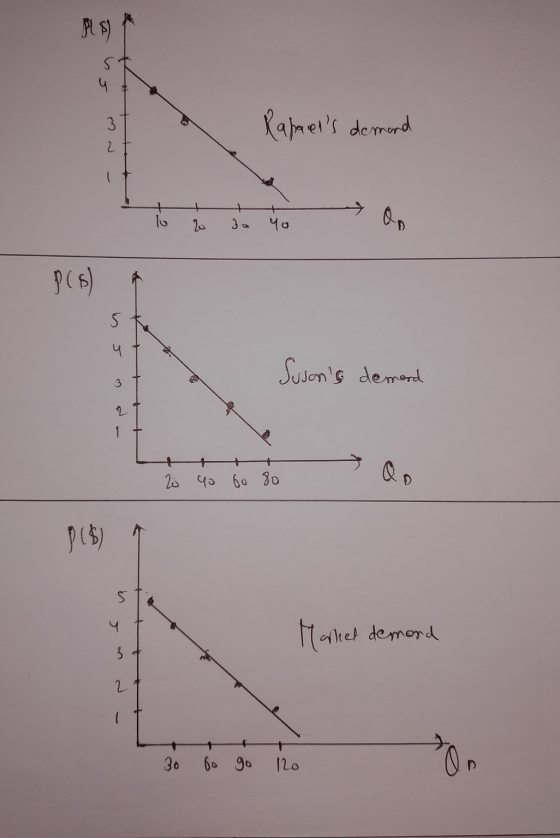
 3. Individual and market demand Suppose that Kevin and Maria are the only consumers of pizza slices in a particular market. The following table shows their annual demand schedules: Price (Dollars per slice) Kevin's Quantity Demanded Maria's Quantity Demanded (Slices) (Slices) 40 80 60 40 20 5 10 On the following graph, plot Kevin's demand for pizza slices using the green points (triangle symbol). Next, plot Maria's demand for pizza slices using the purple points (diamond symbol). Finally, plot the market demand for...
Suppose that Paolo and Sharon are the only consumers of pizza slices in a particular market
 3. The demand schedule and demand curveSuppose that Paolo and Sharon are the only consumers of pizza slices in a particular market. The following table shows their annual demand schedules:PricePaolo's Quantity DemandedSharon's Quantity Demanded(Dollars per slice)(Slices)(Slices)14060225403153045205010On the following graph, plot Paolo's demand for pizza slices using the green points (triangle symbol). Next, plot Sharon's demand for pizza slices using the purple points (diamond symbol). Finally, plot the market demand for pizza slices using the blue points (circle symbol).Now, suppose that...
3. Individual and market demand Suppose that Nick and Rosa are the only consumers of pizza...
 3. Individual and market demand Suppose that Nick and Rosa are the only consumers of pizza slices in a particular market. The following table shows their weekly demand schedules: Price (Dollars per slice) Nick's Quantity Demanded (Slices) Rosa's Quantity Demanded (Slices) On the following graph, plot Nick's demand for pizza slices using the green points (triangle symbol). Next, plot Rosa's demand for plzza slices using the purple points (diamond symbol). Finally, plot the market demand for pizza slices using the...
3. Individual and market demand Suppose that Vakov and Ana are the only consumers of pizza...
 3. Individual and market demand Suppose that Vakov and Ana are the only consumers of pizza slices in a particular market. The following table shows their weekly demand schedules: Price Yakov's Quantity Demanded Ana's Quantity Demanded (Dollars per slice) (Slices) (Slices) 16 12 On the following graph, plot Yakov's demand for pizza slices using the green points (triangle symbol). Next, plot Ana's demand for pizza slices using the purple points (diamond symbol). Finally, plot the market demand for pizza slices...
Suppose that Eric and Ginny are the only suppliers of pizza slices in a particular market....
 Suppose that Eric and Ginny are the only suppliers of pizza slices in a particular market. The following table shows their weekly supply schedules: Price (Dollars per slice) 1 Eric's Quantity Supplied Ginny's Quantity Supplied (Slices) (Slices) 0 2 4 7 3 6 9 4 7 10 11 5 8 On the following graph, plot Eric's supply of pizza slices using the green points (triangle symbol). Next, plot Ginny's supply of pizza slices using the purple points (diamond symbol). Finally,...
Suppose that Kevin and Maria are the only suppliers of plaza slices in a particular market....
 Suppose that Kevin and Maria are the only suppliers of plaza slices in a particular market. The following table shows their weekly supply schedules: Price (Dollars per slice) Kevin's Quantity Supplied (Slices) Maria's Quantity Supplied (Slices) On the following graph, plot hasin's supply of plaza slices using the green points (triangle symbol). Next, plot Maria's supply of pizza slices using the purple points (diamond symbol). Finally, plot the market supply of pizza slices using the orange points (square symbol). Note:...
Individual and Market Demand 3. Individual and market demand particular market. The following table shows their...
 Individual and Market Demand
3. Individual and market demand particular market. The following table shows their weekly demand Suppose that Carlos and Deborah are the only consumers of pizza slices in schedules: Deborah's Quantity Demanded Carlos's Quantity Demanded Price (Slices) (Slices) (Dollars per slice) 16 8 1 12 4 8 2 3 4 4 2 0 5 On the following graph, plot Carlos's demand for pizza slices using the green points (triangle symbol). Next,, plot Deborah's demand for pizza slices...
Individual and Market Demand
3. Individual and market demand particular market. The following table shows their weekly demand Suppose that Carlos and Deborah are the only consumers of pizza slices in schedules: Deborah's Quantity Demanded Carlos's Quantity Demanded Price (Slices) (Slices) (Dollars per slice) 16 8 1 12 4 8 2 3 4 4 2 0 5 On the following graph, plot Carlos's demand for pizza slices using the green points (triangle symbol). Next,, plot Deborah's demand for pizza slices...
Suppose that Shen and Valerie are the only suppliers of pizza slices in a particular marke
 6. Individual and market supply Suppose that Shen and Valerie are the only suppliers of pizza slices in a particular market. The following table shows their weekly supply schedules: Price (Dollars per slice)Shen's Quantity Supplied (Slices)Valerie's Quantity Supplied (Slices)10422733944105511On the following graph, plot Shen's supply of pizza slices using the green points (triangle symbol). Next, plot Valerie's supply of pizza slices using purple points (diamond symbol). Finally, plot the market supply of pizza slices using the orange points (square symbol).
Suppose that Alex and Becky are the only consumers of shoes in a particular market. The...
 Suppose that Alex and Becky are the only consumers of shoes in a particular market. The following table shows their annual demand schedules Price (Dollars per pair) 10 20 30 40 50 Alex's Quantity Demanded (Pairs) 32 20 12 4 Becky's Quantity Demanded Pairs 64 48 32 24 16 On the following graph, plot Alex's demand for shoes using the green points (triangle symbol). Next, plot Becky's demand for shoes using the purple points (diamond symbol). Finally, plot the market...
 3. Individual and market demand Suppose that Kevin and Maria are the only consumers of pizza slices in a particular market. The following table shows their annual demand schedules: Price (Dollars per slice) Kevin's Quantity Demanded Maria's Quantity Demanded (Slices) (Slices) 40 80 60 40 20 5 10 On the following graph, plot Kevin's demand for pizza slices using the green points (triangle symbol). Next, plot Maria's demand for pizza slices using the purple points (diamond symbol). Finally, plot the market demand for...
 3. Individual and market demand Suppose that Nick and Rosa are the only consumers of pizza slices in a particular market. The following table shows their weekly demand schedules: Price (Dollars per slice) Nick's Quantity Demanded (Slices) Rosa's Quantity Demanded (Slices) On the following graph, plot Nick's demand for pizza slices using the green points (triangle symbol). Next, plot Rosa's demand for plzza slices using the purple points (diamond symbol). Finally, plot the market demand for pizza slices using the...
 3. Individual and market demand Suppose that Vakov and Ana are the only consumers of pizza slices in a particular market. The following table shows their weekly demand schedules: Price Yakov's Quantity Demanded Ana's Quantity Demanded (Dollars per slice) (Slices) (Slices) 16 12 On the following graph, plot Yakov's demand for pizza slices using the green points (triangle symbol). Next, plot Ana's demand for pizza slices using the purple points (diamond symbol). Finally, plot the market demand for pizza slices...
 Suppose that Eric and Ginny are the only suppliers of pizza slices in a particular market. The following table shows their weekly supply schedules: Price (Dollars per slice) 1 Eric's Quantity Supplied Ginny's Quantity Supplied (Slices) (Slices) 0 2 4 7 3 6 9 4 7 10 11 5 8 On the following graph, plot Eric's supply of pizza slices using the green points (triangle symbol). Next, plot Ginny's supply of pizza slices using the purple points (diamond symbol). Finally,...
 Suppose that Kevin and Maria are the only suppliers of plaza slices in a particular market. The following table shows their weekly supply schedules: Price (Dollars per slice) Kevin's Quantity Supplied (Slices) Maria's Quantity Supplied (Slices) On the following graph, plot hasin's supply of plaza slices using the green points (triangle symbol). Next, plot Maria's supply of pizza slices using the purple points (diamond symbol). Finally, plot the market supply of pizza slices using the orange points (square symbol). Note:...
 Individual and Market Demand
3. Individual and market demand particular market. The following table shows their weekly demand Suppose that Carlos and Deborah are the only consumers of pizza slices in schedules: Deborah's Quantity Demanded Carlos's Quantity Demanded Price (Slices) (Slices) (Dollars per slice) 16 8 1 12 4 8 2 3 4 4 2 0 5 On the following graph, plot Carlos's demand for pizza slices using the green points (triangle symbol). Next,, plot Deborah's demand for pizza slices...
Individual and Market Demand
3. Individual and market demand particular market. The following table shows their weekly demand Suppose that Carlos and Deborah are the only consumers of pizza slices in schedules: Deborah's Quantity Demanded Carlos's Quantity Demanded Price (Slices) (Slices) (Dollars per slice) 16 8 1 12 4 8 2 3 4 4 2 0 5 On the following graph, plot Carlos's demand for pizza slices using the green points (triangle symbol). Next,, plot Deborah's demand for pizza slices...
 Suppose that Alex and Becky are the only consumers of shoes in a particular market. The following table shows their annual demand schedules Price (Dollars per pair) 10 20 30 40 50 Alex's Quantity Demanded (Pairs) 32 20 12 4 Becky's Quantity Demanded Pairs 64 48 32 24 16 On the following graph, plot Alex's demand for shoes using the green points (triangle symbol). Next, plot Becky's demand for shoes using the purple points (diamond symbol). Finally, plot the market...
Most questions answered within 3 hours.
-
At the beginning of the period, the Fabricating Department
budgeted direct labor of $136,500 and equipment...
asked 9 minutes ago -
Please answer all
____ 28. Rent control is usually
justified on the grounds that it protects...
asked 9 minutes ago -
PARTS A-D HAVE BEEN ANSWERED. WAS TOLD TO REPOST. ONLY ANSWER
PARTS E and F.
A...
asked 27 minutes ago -
2) You are given the task of finding a representation for a
circle in a drawing...
asked 1 hour ago -
STUDY QUESTION: Does use of diet drug fen-phen
(fenfluramine-phentermine) cause valvular heart disease?
HINT: Valvular heart...
asked 1 hour ago -
1. An object weighing 40 N rests on a surface. The coefficient
of friction is 0.35....
asked 2 hours ago -
Investor company owns 35% of investee company voting stock and
accounts for the investment under the...
asked 3 hours ago -
The number of major faults on a randomly chosen 1 km stretch of
highway has a...
asked 4 hours ago -
Consider the competitive environment of Starbuck's, Progressive
Insurance, a manufacturing firm with low turnover, or a...
asked 4 hours ago -
3. Gains from trade
Consider two neighbouring island countries called Euphoria and
Contente. They each have...
asked 6 hours ago -
A business executive has the option to invest money in two
plans: Plan A guarantees that...
asked 9 hours ago -
Hello, can someone please help me answer this question?
How much heat is absorbed by a...
asked 9 hours ago