


Homework Answers
1> D 6
The corresponding quantity on the demand curve for a price of $4 is 6 units.
2> A
Since it is an increasing cost industry, the average cost to produce more units will be higher, thus it would be more than $2 but it will be less than $4 because there will be more firms who will enter the market which will drive down the price in the long run.
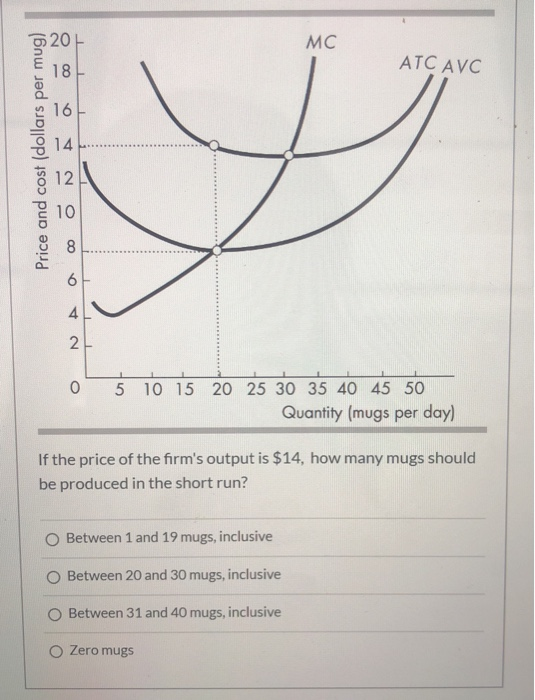
3> C
We can see that ATC is the lowest at 30 units and then it starts increasing and it is more than $14 after 40 units. So, somewhere between 30 and 40 mugs, the profit will be maximum.
4> B
At a quantity of 8 units, clearly ATC is more than the corresponding price of $2, so he will make economic loss.
Add Answer to:
pleaser answer all four questions. thank you.
10 MC 8 Price and costs (dollars per unit)...
QUESTION 39 Price and cost MC ATC AVC N O P MR Demand RSTU Quantity (per...
 QUESTION 39 Price and cost MC ATC AVC N O P MR Demand RSTU Quantity (per period) The figure above shows different curves for a short-run monopolist. What is the profit-maximizing quantity level? OQ OR Os От Ου
Price and cost (dollars per appointment) MC + MR 2 4 6 8 10 Quantity appointments...
 Price and cost (dollars per appointment) MC + MR 2 4 6 8 10 Quantity appointments per hour) Use the figure above to answer this question. Mary is the only veterinarian in a small town and rents a space for her practice. If Mary's landlord decided to charge per hour in rent, Mary would O $20 more; earn $0 economic profit O $20 more; still earn an economic profit because she is a monopolist O $30 more; operate on the...
Price $ per month mandu ATC MC 1 2 3 4 5 6 7 8 9...
 Price $ per month mandu ATC MC 1 2 3 4 5 6 7 8 9 10 MR Quantity in Oos At the profit maximizing price and quantity, the firm's total monthly profits are A. $160,000 B. $200,000 C. $40,000 D. $50,000
$ per unit MC ATC MR $40 AVC $20 2 4 6 8 10 12 Output (9) The graph above shows a firm's Marginal Revenue (MR), M...
 $ per unit MC ATC MR $40 AVC $20 2 4 6 8 10 12 Output (9) The graph above shows a firm's Marginal Revenue (MR), Marginal Cost (MC), Average Total Cost (ATC) and Average Variable Cost (AVC). This firm is a profit-maximizing price taker. Find the firm's short run shutdown price. (Do not include a S sign in your response. Round to the nearest two decimal places if necessary.) Answer: Check
Price/Cost ($) 7) Monopoly II (6 points) The marginal costs (MC), average variable costs (AVC), and...
 Price/Cost ($) 7) Monopoly II (6 points) The marginal costs (MC), average variable costs (AVC), and average total costs (ATC) for a monopoly are shown in the figure below. The figure also shows the demand curve (D) and the marginal revenue curve (MR) for this market. 501 ATC AVC a. What is the firm's profit-maximizing level of output? Label this on the graph. b. What price will the monopolist charge for that level of output? Label this on the graph....
Price (dollars per pound) 5 MC ATC Market prio D-MR 2 1 0 10 20 30...
 Price (dollars per pound) 5 MC ATC Market prio D-MR 2 1 0 10 20 30 40 Quantity (thousands of pounds) Figure 12-6 shows the demand, marginal cost (MC) and average total cost (ATC) curves for Jason's House of Apples. Refer to Figure 12-6. To maximize his proft, Jason should produce the level of output indicated by point Od OG
Exhibit 7-17 Marginal revenue and cost per unit curves DMC ATC Price and costs per unit...
 Exhibit 7-17 Marginal revenue and cost per unit curves DMC ATC Price and costs per unit (dollars) AVC 0 20 100 40 60 80 Quantity of output (units per day) 16. As shown in Exhibit 7-17, the price at which the firm earns zero economic profit in the short-runis a. $10 per unit. b. $15 per unit. c. $40 per unit. d. more than $20 per unit. e. $20 per unit. 17. In long-run equilibrium, the typical perfectly competitive firm...
Answer A-H Please Answer the following Questions for a Monopoly Firm. Price Quantity TR MR MC...
Answer A-H Please Answer the following Questions for a Monopoly Firm. Price Quantity TR MR MC TC Profit $15,000 0 ---- ---- $50,000 14,000 1 $52,000 13,000 2 $53,000 12,000 3 54,000 11,000 4 $2,000 10,000 5 59,000 9,000 6 4,000 8,000 7 $69,000 7,000 8 $8,000 6,000 9 5,000 10 4,000 11 $18,000 3,000 12 $143,000 a) Fill in the missing information above for this Monopoly Firm for its monthly production. Note there are no numbers for MC and...
MC ATC Dollars MR Q₂ Q, Q₂ Quantity Use the above figure. The profit-maximizing price will...
 MC ATC Dollars MR Q₂ Q, Q₂ Quantity Use the above figure. The profit-maximizing price will be
Price (dollars per pound) ATC Market 3 -D= MR price 1 10 20 40 30 Quantity...
 Price (dollars per pound) ATC Market 3 -D= MR price 1 10 20 40 30 Quantity (thousands of pounds) Figure 12-6 shows the demand, marginal cost (MC) and average total cost (ATC) curves for Jason's House of Apples. Refer to Figure 12-6. To maximize his profit, Jason should produce____- apples. A) 20 B) around 34 OC) around 24 D) 10
 QUESTION 39 Price and cost MC ATC AVC N O P MR Demand RSTU Quantity (per period) The figure above shows different curves for a short-run monopolist. What is the profit-maximizing quantity level? OQ OR Os От Ου
 Price and cost (dollars per appointment) MC + MR 2 4 6 8 10 Quantity appointments per hour) Use the figure above to answer this question. Mary is the only veterinarian in a small town and rents a space for her practice. If Mary's landlord decided to charge per hour in rent, Mary would O $20 more; earn $0 economic profit O $20 more; still earn an economic profit because she is a monopolist O $30 more; operate on the...
 Price $ per month mandu ATC MC 1 2 3 4 5 6 7 8 9 10 MR Quantity in Oos At the profit maximizing price and quantity, the firm's total monthly profits are A. $160,000 B. $200,000 C. $40,000 D. $50,000
 $ per unit MC ATC MR $40 AVC $20 2 4 6 8 10 12 Output (9) The graph above shows a firm's Marginal Revenue (MR), Marginal Cost (MC), Average Total Cost (ATC) and Average Variable Cost (AVC). This firm is a profit-maximizing price taker. Find the firm's short run shutdown price. (Do not include a S sign in your response. Round to the nearest two decimal places if necessary.) Answer: Check
 Price/Cost ($) 7) Monopoly II (6 points) The marginal costs (MC), average variable costs (AVC), and average total costs (ATC) for a monopoly are shown in the figure below. The figure also shows the demand curve (D) and the marginal revenue curve (MR) for this market. 501 ATC AVC a. What is the firm's profit-maximizing level of output? Label this on the graph. b. What price will the monopolist charge for that level of output? Label this on the graph....
 Price (dollars per pound) 5 MC ATC Market prio D-MR 2 1 0 10 20 30 40 Quantity (thousands of pounds) Figure 12-6 shows the demand, marginal cost (MC) and average total cost (ATC) curves for Jason's House of Apples. Refer to Figure 12-6. To maximize his proft, Jason should produce the level of output indicated by point Od OG
 Exhibit 7-17 Marginal revenue and cost per unit curves DMC ATC Price and costs per unit (dollars) AVC 0 20 100 40 60 80 Quantity of output (units per day) 16. As shown in Exhibit 7-17, the price at which the firm earns zero economic profit in the short-runis a. $10 per unit. b. $15 per unit. c. $40 per unit. d. more than $20 per unit. e. $20 per unit. 17. In long-run equilibrium, the typical perfectly competitive firm...
 MC ATC Dollars MR Q₂ Q, Q₂ Quantity Use the above figure. The profit-maximizing price will be
 Price (dollars per pound) ATC Market 3 -D= MR price 1 10 20 40 30 Quantity (thousands of pounds) Figure 12-6 shows the demand, marginal cost (MC) and average total cost (ATC) curves for Jason's House of Apples. Refer to Figure 12-6. To maximize his profit, Jason should produce____- apples. A) 20 B) around 34 OC) around 24 D) 10
Most questions answered within 3 hours.
-
To move a refrigerator of mass 140 kg into a house, a mover puts
it on...
asked 30 seconds from now -
what is the formula, molecular weight , melting point and
one-word hazard for p-dichlorobenzene?
asked 3 minutes ago -
10. Which of the following is NOT a physical
barrier method of birth control?
vastecomy
female...
asked 3 minutes ago -
A gene mutation that is hypermorphic in nature likely has a
mutation in its....
Promoter
Coding...
asked 9 minutes ago -
1)A flask containing oxygen has a volume of 3.5 dm at a pressure
of 3.5 bar....
asked 9 minutes ago -
Recall the Application about the price of vanity license
plates in Virginia to answer the following...
asked 10 minutes ago -
Why does H2O act like an acid and give up one of its hygrogen
atoms when...
asked 11 minutes ago -
which atom is most electronegative
- P
-Cs
-Cl
-Li
Which of the following anions same...
asked 11 minutes ago -
Find the t-value that has an area in the lower tail of
.10 when n=18.
Group...
asked 14 minutes ago -
Montecino Corporation uses two different types of labor to
manufacture its product. The types of labor,...
asked 32 minutes ago -
4. What are the two possible products of the
intramolecular hemiacetal formation of linear glucose?
5. ...
asked 54 minutes ago -
The opportunity cost of attending university is likely to
include all except which of the following?...
asked 56 minutes ago