
Homework Answers
Solution:-
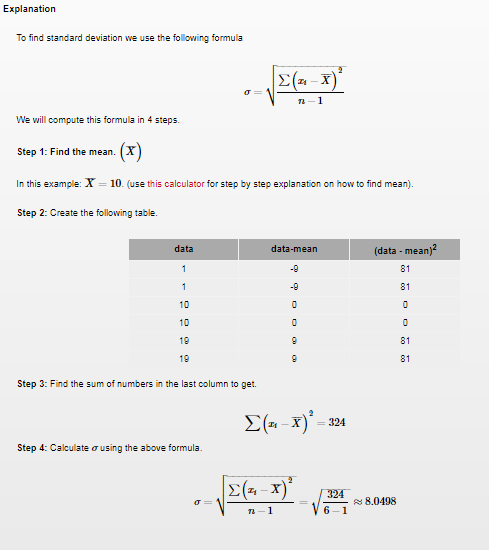
b) Standard deviation :-
Set A : - sd = 2.2361
Set B :- sd = 0
Set C :- sd = 8.0498
-------------------------------
Set A:

Set C:
Add Answer to:
3. Consider the following three data sets and answer the questions that follow A=(9, 10, 11,...
Part 1 For the following three data sets, calculate the: a. mean (3 pts) b. median...
 Part 1 For the following three data sets, calculate the: a. mean (3 pts) b. median (2 pts) c mode (1 pt) d. range (2 pts) e. variance (5 pts) f standard deviation (2 pts) Data Set 1 3, 4, 2, 2, 3, 4, 2,1, 9, 6, 2, 5, 6, 3, 2, 4, 2 Data Set 2: 23, 22, 21, 22, 22, 22, 21, 23, 25, 23, 22, 23, 24, 25, 25, 21 Data Set 3: 13, 18, 34, 1,...
Consider the following three sets of observations. SetlObservations 1 8,9,10, 11, 12 2 8,9, 10, 11,...
 Consider the following three sets of observations. SetlObservations 1 8,9,10, 11, 12 2 8,9, 10, 11, 100 3 13, 8, 10, 11, 1000 (a) What is the median for data set 1? data set 27 data set 3? (b) What is the mean for.. data set 1? data set 27 data set 3? (c) What do these datasets illustrate about the resistance of the mean and median to outliers? O The mean is resistant to outliers, but the median is...
solve the following questions Raw data is organized into a frequency table. Why would the raw...
 solve the following questions
Raw data is organized into a frequency table. Why would the raw data to differ from the mean of the frequency table? 13. we expect the mean of 14. mode, but different standard deviations Create two data sets, each with n = 5, that have the same mean, median, and 15. Construct a data set for which N = 7, u = 9, a = 0 16. Graphical Reasoning Both data sets shown in the stem-and-leaf...
solve the following questions
Raw data is organized into a frequency table. Why would the raw data to differ from the mean of the frequency table? 13. we expect the mean of 14. mode, but different standard deviations Create two data sets, each with n = 5, that have the same mean, median, and 15. Construct a data set for which N = 7, u = 9, a = 0 16. Graphical Reasoning Both data sets shown in the stem-and-leaf...
Consider the following two sample data sets, 19 Set 1 12 23 13 24 Set 2:...
 Consider the following two sample data sets, 19 Set 1 12 23 13 24 Set 2: 1 916 a. Calculate the coefficient of variation for each data set. b. Which data set has more variability? %. a. The coefficient of variation for data set 1 is (Round to one decimal place as needed.)
Consider the following sample data values. 3 17 1 19 13 8 18 11 a) Calculate...
 Consider the following sample data values. 3 17 1 19 13 8 18 11 a) Calculate the range b) Calculate the sample variance. c) Calculate the sample standard deviation. a) The range is 18 b) The sample variance is (Round to two decimal places as needed.)
please Answer question 9 and 10 Question 4 answer is : The distribution is not normally...
 please Answer question 9 and 10
Question 4 answer is : The distribution is not normally
distributed.
Question 6 answer is : 80%
Question 7 answer is : 92%
Question 8 answer is : 98%
Question: Using the computer (Excel), answer the following 10 questions: Assessing Normality Many times in statistics it is necessary to see if a set of data values is approximately normally dis- tributed. There are special techniques that can be used. One technique is to draw...
please Answer question 9 and 10
Question 4 answer is : The distribution is not normally
distributed.
Question 6 answer is : 80%
Question 7 answer is : 92%
Question 8 answer is : 98%
Question: Using the computer (Excel), answer the following 10 questions: Assessing Normality Many times in statistics it is necessary to see if a set of data values is approximately normally dis- tributed. There are special techniques that can be used. One technique is to draw...
questions from 10 to 19 Find the outlier in the set of data. 10. 15, 35,...
 questions from 10 to 19
Find the outlier in the set of data. 10. 15, 35, 10, 22, 13, 18, 19, 14 11. The scores on an exam are normally distributed, with a nean of 81 and a standard deviation of 10. What percent of the scores are less than 917 12. A grocery store will only accept yellow onions that are at least 3.25 in. n diameter. A grower has a crop of onions with diameters that are normally...
questions from 10 to 19
Find the outlier in the set of data. 10. 15, 35, 10, 22, 13, 18, 19, 14 11. The scores on an exam are normally distributed, with a nean of 81 and a standard deviation of 10. What percent of the scores are less than 917 12. A grocery store will only accept yellow onions that are at least 3.25 in. n diameter. A grower has a crop of onions with diameters that are normally...
Consider the following sample data. Sample A: 11, 22, 33 Sample B: 81, 92, 103 Sample...
Consider the following sample data. Sample A: 11, 22, 33 Sample B: 81, 92, 103 Sample C: 1,100; 1,111; 1,122 (a) Find the mean and standard deviation for each sample. Sample A: Sample B: Sample C: Mean Sample Standard Deviation (b) What does this exercise show about the standard deviation? The idea is to illustrate that the standard deviation is not a function of the value of the mean. The idea is to illustrate that the standard deviation is a...
Consider the following stock price data (in dollars) to answer the questions in this section. Use...
 Consider the following stock price data (in dollars) to answer the questions in this section. Use R. 10 7 20 12 75 15 9 18 4 12 14 8 Definitions: 1. Mean, median, mode, and standard deviation are obvious 2. Min-Max normalization: if x is a vector variable, the (x - min(x))/(max(x) - min(x)) 3. To find z-scores use the scale() function in R 4. Decimal scaling: Find the biggest absolute value in the data, count the number of digits...
Consider the following stock price data (in dollars) to answer the questions in this section. Use...
 Consider the following stock price data (in dollars) to answer the questions in this section. Use R. 10 7 20 12 75 15 9 18 4 12 8 14 Definitions: 1. Mean, median, mode, and standard deviation are obvious 2. Min-Max normalization: if x is a vector variable, the (x - min(x))/(max(x) - min(x)) 3. To find z-scores use the scale() function in R 4. Decimal scaling: Find the biggest absolute value in the data, count the number of digits...
 Part 1 For the following three data sets, calculate the: a. mean (3 pts) b. median (2 pts) c mode (1 pt) d. range (2 pts) e. variance (5 pts) f standard deviation (2 pts) Data Set 1 3, 4, 2, 2, 3, 4, 2,1, 9, 6, 2, 5, 6, 3, 2, 4, 2 Data Set 2: 23, 22, 21, 22, 22, 22, 21, 23, 25, 23, 22, 23, 24, 25, 25, 21 Data Set 3: 13, 18, 34, 1,...
 Consider the following three sets of observations. SetlObservations 1 8,9,10, 11, 12 2 8,9, 10, 11, 100 3 13, 8, 10, 11, 1000 (a) What is the median for data set 1? data set 27 data set 3? (b) What is the mean for.. data set 1? data set 27 data set 3? (c) What do these datasets illustrate about the resistance of the mean and median to outliers? O The mean is resistant to outliers, but the median is...
 solve the following questions
Raw data is organized into a frequency table. Why would the raw data to differ from the mean of the frequency table? 13. we expect the mean of 14. mode, but different standard deviations Create two data sets, each with n = 5, that have the same mean, median, and 15. Construct a data set for which N = 7, u = 9, a = 0 16. Graphical Reasoning Both data sets shown in the stem-and-leaf...
solve the following questions
Raw data is organized into a frequency table. Why would the raw data to differ from the mean of the frequency table? 13. we expect the mean of 14. mode, but different standard deviations Create two data sets, each with n = 5, that have the same mean, median, and 15. Construct a data set for which N = 7, u = 9, a = 0 16. Graphical Reasoning Both data sets shown in the stem-and-leaf...
 Consider the following two sample data sets, 19 Set 1 12 23 13 24 Set 2: 1 916 a. Calculate the coefficient of variation for each data set. b. Which data set has more variability? %. a. The coefficient of variation for data set 1 is (Round to one decimal place as needed.)
 Consider the following sample data values. 3 17 1 19 13 8 18 11 a) Calculate the range b) Calculate the sample variance. c) Calculate the sample standard deviation. a) The range is 18 b) The sample variance is (Round to two decimal places as needed.)
 please Answer question 9 and 10
Question 4 answer is : The distribution is not normally
distributed.
Question 6 answer is : 80%
Question 7 answer is : 92%
Question 8 answer is : 98%
Question: Using the computer (Excel), answer the following 10 questions: Assessing Normality Many times in statistics it is necessary to see if a set of data values is approximately normally dis- tributed. There are special techniques that can be used. One technique is to draw...
please Answer question 9 and 10
Question 4 answer is : The distribution is not normally
distributed.
Question 6 answer is : 80%
Question 7 answer is : 92%
Question 8 answer is : 98%
Question: Using the computer (Excel), answer the following 10 questions: Assessing Normality Many times in statistics it is necessary to see if a set of data values is approximately normally dis- tributed. There are special techniques that can be used. One technique is to draw...
 questions from 10 to 19
Find the outlier in the set of data. 10. 15, 35, 10, 22, 13, 18, 19, 14 11. The scores on an exam are normally distributed, with a nean of 81 and a standard deviation of 10. What percent of the scores are less than 917 12. A grocery store will only accept yellow onions that are at least 3.25 in. n diameter. A grower has a crop of onions with diameters that are normally...
questions from 10 to 19
Find the outlier in the set of data. 10. 15, 35, 10, 22, 13, 18, 19, 14 11. The scores on an exam are normally distributed, with a nean of 81 and a standard deviation of 10. What percent of the scores are less than 917 12. A grocery store will only accept yellow onions that are at least 3.25 in. n diameter. A grower has a crop of onions with diameters that are normally...
 Consider the following stock price data (in dollars) to answer the questions in this section. Use R. 10 7 20 12 75 15 9 18 4 12 14 8 Definitions: 1. Mean, median, mode, and standard deviation are obvious 2. Min-Max normalization: if x is a vector variable, the (x - min(x))/(max(x) - min(x)) 3. To find z-scores use the scale() function in R 4. Decimal scaling: Find the biggest absolute value in the data, count the number of digits...
 Consider the following stock price data (in dollars) to answer the questions in this section. Use R. 10 7 20 12 75 15 9 18 4 12 8 14 Definitions: 1. Mean, median, mode, and standard deviation are obvious 2. Min-Max normalization: if x is a vector variable, the (x - min(x))/(max(x) - min(x)) 3. To find z-scores use the scale() function in R 4. Decimal scaling: Find the biggest absolute value in the data, count the number of digits...
Most questions answered within 3 hours.
-
Rice Products in Bangladesh
Business behavior is derived in large part from the basic cultural
environment...
asked 9 minutes ago -
The following base sequence is found for a mRNA fragment from
wild-type E. coli: 5'- UAUCAGUAGAUAAUGUAACC-3'...
asked 32 minutes ago -
For this exercise, round all regression parameters to three
decimal places.
One of the two tables...
asked 50 minutes ago -
What is the 5% level of significance for mean = 3.60, standard
deviation = 0.94, and...
asked 54 minutes ago -
Prior to beginning work on this discussion, please read the
article by Hayley Peterson, 15 Companies...
asked 1 hour ago -
Which pair of aqueous solutions, when mixed, will form a
precipitate?
A) NaNO3 and AgC2H3O2
B)...
asked 1 hour ago -
1-Write an algorithm to get two numbers from the user (as
inputs) and calculate the sum...
asked 5 hours ago -
Define white-collar crime. What is the difference between
offender and offense-based definitions of white-collar crime? What...
asked 5 hours ago -
Consider a reaction which is 1st order with respect to A and 1st
order with respect...
asked 5 hours ago -
c++
The length of the hypotenuse of a right-angled triangle is the
square root of the...
asked 5 hours ago -
When a metal rod is heated, not only its resistance but also its
length and cross‐sectional...
asked 6 hours ago -
write a c++ program that computes the L^1 - Norm of a given
vector (L^1 norm...
asked 6 hours ago