
Homework Answers
The statistic software output for this problem is :
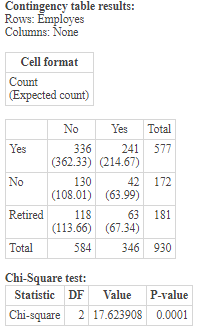
A) Test statistics is  = 17.62
Add Answer to:
A survey asked 1000 adults about their employment status and whether they owned stocks. The table...
Many companies outsource segments of their business to external providers, such as information technology (IT) and...
 Many companies outsource segments of their business to external providers, such as information technology (IT) and human resources (HR). The data below show the types of outsourcing decisions made by a sample of companies from various industry sectors. No Do these data highlight significant differences in outsourcing by industry sector? Complete parts a through e below. Outsourcing 466 Healthcare Financial Industrial Goods Consumer Goods HR Only 4812 611 442 254 Only 5680 1608 1286 414 Both IT and HR 950...
In a recent poll 1049 randomly selected adults were asked whether they approve of labor unions:...
 In a recent poll 1049 randomly selected adults were asked whether they approve of labor unions: 64% said yes. In 1936, about 68% of adults approved of labor unions. At the 5% significance level, do the data provide sufficient evidence to conclude that the percentage of adults who approve of labor unions has decreased since 1936? Use the one-proportion 2-test to perform the appropriate hypothesis test, after checking the conditions for the procedure. What are the hypotheses for the one...
In a study of the effect of college student employment on academic performance, the following summary...
In a study of the effect of college student employment on academic performance, the following summary statistics for GPA were reported for a sample of students who worked and for a sample of students who did not work. The samples were selected at random from working and nonworking students at a university. (Use a statistical computer package to calculate the P-value. Use ?employed ? ?not employed. Round your test statistic to two decimal places, your df down to the nearest...
they a were asked whether they approve of labor unons, 62% said yes. In i936, about...
 they a were asked whether they approve of labor unons, 62% said yes. In i936, about 66% of adults approved of labor In a recent pll 1093 randomly selected adults to conclude that the percentage of adults who approve of labor unions has decreased unions At the 5% Significance level, do the data provide sufficient evidence since 19367 Use What are the hypotheses for the one-proportion z-test? the one proportion 2-test to perform the appropriate hypothesis test, after checking the...
A poll was conducted to investigate opinions about global warming. The respondents who answered yes when...
A poll was conducted to investigate opinions about global warming. The respondents who answered yes when asked if there is solid evidence that the earth is getting warmer were then asked to select a cause of global warming. The results are given in the accompanying data table. Use a 0.01 significance level to test the claim that the sex of the respondent is independent of the choice for the cause of global warming. Do men and women appear to agree,...
A company with a fleet of 150 cars found that the emissions systems of 4 out...
A company with a fleet of 150 cars found that the emissions systems of 4 out of the 24 they randomly tested failed to meet pollution control guidelines. Is this strong evidence that more than 25 % of the fleet might be out of compliance? Test an appropriate hypothesis and state your conclusion. Be sure the appropriate assumptions and conditions are satisfied before you proceed. Are the assumptions and the conditions to perform a one-proportion z-test met? No Yes State...
For the following information, determine whether a normal sampling distribution can be used, where p is...
 For the following information, determine whether a normal sampling distribution can be used, where p is the population proportion, a is the level of significance, p is the sample proportion, and n is the sample size. If it can be used, test the claim. Claim: p20.47; a = 0.06. Sample statistics : P = 0.40, n = 150 Let q=1-p and let = 1-P. A normal sampling distribution be used here, since v and If a normal sampling distribution can...
The table shows the results of a study investigating whether aftereffects of epidurals administered during childbirth...
 The table shows the results of a study investigating whether
aftereffects of epidurals administered during childbirth might
interfere with successful breastfeeding. We're planning to do a
chi-square test. Complete parts a through c.
The table shows the results of a study investigating whether aftereffects of epidurals administered during childbirth might intefere with successful breastfeeding. We're Breastfeeding planning to do a chi-square test. Complete parts a through c. Yes 205 183 388 Epidural? No 493 278 Total 698 461 1159 Yes...
The table shows the results of a study investigating whether
aftereffects of epidurals administered during childbirth might
interfere with successful breastfeeding. We're planning to do a
chi-square test. Complete parts a through c.
The table shows the results of a study investigating whether aftereffects of epidurals administered during childbirth might intefere with successful breastfeeding. We're Breastfeeding planning to do a chi-square test. Complete parts a through c. Yes 205 183 388 Epidural? No 493 278 Total 698 461 1159 Yes...
For the following information, determine whether a normal sampling distribution can be used, where p is...
For the following information, determine whether a normal sampling distribution can be used, where p is the population proportion, α is the level ofsignificance, p is the sample proportion, and n is the sample size. If it can be used, test the claim.Claim: p≥0.28; α=0.04. Sample statistics: p=0.20, n=140 Let q=1−p and let q=1−p. A normal sampling distribution ▼ cannot can be used here, since ▼ npnp n ModifyingAbove p with caretnp ▼ less than< greater than or equals≥ 5...
The data shown below for the dependent variable, y, and the independent variable, x, have been ...
 The data shown below for the dependent variable, y, and the
independent variable, x, have been collected using simple random
sampling.
x y
11 100
13 80
15 80
12 90
20 60
17 60
15 70
13 90
15 90
17 80
a. Complete the linear regression equation below Round to one decimal place as needed.) b. Calculate the sum of the squared residuals. SSE-L (Round to the nearest whole number as needed) What is the total sum of...
The data shown below for the dependent variable, y, and the
independent variable, x, have been collected using simple random
sampling.
x y
11 100
13 80
15 80
12 90
20 60
17 60
15 70
13 90
15 90
17 80
a. Complete the linear regression equation below Round to one decimal place as needed.) b. Calculate the sum of the squared residuals. SSE-L (Round to the nearest whole number as needed) What is the total sum of...
 Many companies outsource segments of their business to external providers, such as information technology (IT) and human resources (HR). The data below show the types of outsourcing decisions made by a sample of companies from various industry sectors. No Do these data highlight significant differences in outsourcing by industry sector? Complete parts a through e below. Outsourcing 466 Healthcare Financial Industrial Goods Consumer Goods HR Only 4812 611 442 254 Only 5680 1608 1286 414 Both IT and HR 950...
 In a recent poll 1049 randomly selected adults were asked whether they approve of labor unions: 64% said yes. In 1936, about 68% of adults approved of labor unions. At the 5% significance level, do the data provide sufficient evidence to conclude that the percentage of adults who approve of labor unions has decreased since 1936? Use the one-proportion 2-test to perform the appropriate hypothesis test, after checking the conditions for the procedure. What are the hypotheses for the one...
 they a were asked whether they approve of labor unons, 62% said yes. In i936, about 66% of adults approved of labor In a recent pll 1093 randomly selected adults to conclude that the percentage of adults who approve of labor unions has decreased unions At the 5% Significance level, do the data provide sufficient evidence since 19367 Use What are the hypotheses for the one-proportion z-test? the one proportion 2-test to perform the appropriate hypothesis test, after checking the...
 For the following information, determine whether a normal sampling distribution can be used, where p is the population proportion, a is the level of significance, p is the sample proportion, and n is the sample size. If it can be used, test the claim. Claim: p20.47; a = 0.06. Sample statistics : P = 0.40, n = 150 Let q=1-p and let = 1-P. A normal sampling distribution be used here, since v and If a normal sampling distribution can...
 The table shows the results of a study investigating whether
aftereffects of epidurals administered during childbirth might
interfere with successful breastfeeding. We're planning to do a
chi-square test. Complete parts a through c.
The table shows the results of a study investigating whether aftereffects of epidurals administered during childbirth might intefere with successful breastfeeding. We're Breastfeeding planning to do a chi-square test. Complete parts a through c. Yes 205 183 388 Epidural? No 493 278 Total 698 461 1159 Yes...
The table shows the results of a study investigating whether
aftereffects of epidurals administered during childbirth might
interfere with successful breastfeeding. We're planning to do a
chi-square test. Complete parts a through c.
The table shows the results of a study investigating whether aftereffects of epidurals administered during childbirth might intefere with successful breastfeeding. We're Breastfeeding planning to do a chi-square test. Complete parts a through c. Yes 205 183 388 Epidural? No 493 278 Total 698 461 1159 Yes...
 The data shown below for the dependent variable, y, and the
independent variable, x, have been collected using simple random
sampling.
x y
11 100
13 80
15 80
12 90
20 60
17 60
15 70
13 90
15 90
17 80
a. Complete the linear regression equation below Round to one decimal place as needed.) b. Calculate the sum of the squared residuals. SSE-L (Round to the nearest whole number as needed) What is the total sum of...
The data shown below for the dependent variable, y, and the
independent variable, x, have been collected using simple random
sampling.
x y
11 100
13 80
15 80
12 90
20 60
17 60
15 70
13 90
15 90
17 80
a. Complete the linear regression equation below Round to one decimal place as needed.) b. Calculate the sum of the squared residuals. SSE-L (Round to the nearest whole number as needed) What is the total sum of...
Most questions answered within 3 hours.
-
3) What are the typical social structures in a global city?
asked 2 hours ago -
Luther Corporation
Consolidated Balance Sheet
December 31, 2019 and 2018 (in $ millions)
Assets
2019
2018...
asked 2 hours ago -
(Expected rate of return and risk) Carter Inc. is evaluating a
security. Calculate the investment’s expected...
asked 4 hours ago -
What specific indicators can point to lack of progress for
African Americans in American society?
asked 5 hours ago -
1-The Electrons in a beam are moving at 2.7×10⁸ m/s in an
electric field of 15000...
asked 6 hours ago -
A gas tank is a vertical cylinder. It has a radius of 1m, a
height of...
asked 6 hours ago -
Accent Software faces the following conditions. All of these
support Accent’s use of a market-penetration pricing...
asked 7 hours ago -
A mathematically inclined friend emails you the following
instructions: "Meet me in the cafeteria the first...
asked 7 hours ago -
A monopoly sells in two countries . The demand curves in the two
countries are p1...
asked 8 hours ago -
A .15kg rubber ball is bounced off a wall. Before hitting the
wall, the ball moves...
asked 9 hours ago -
A manufacturing company preparing to build a new plant is
considering three potential locations for it....
asked 9 hours ago -
B. If compound Y has approximately the same values of solubility
in toluene as compound X,...
asked 10 hours ago