
Homework Answers
A. The term 'x' is the life stage or age class; The term 'nx' refers to the number of individuals at the beginning of the age interval x; The term 'lx' is the proportion of original number of individuals surviving to the next stage or class, basically it means survivorship. The term 'mx' refers to the fecundity rate, i.e average number of female offsprings produced per female in the population over a period of time.
B.
| Age (x) | nx | lx | mx | lxmx | xlxmx |
| 0.00 | 1000 | 1 | 0 |  |
 |
| 1.00 | 400 | 0.4 | 1 |  |
|
| 2.00 | 200 | 0.2 | 3 |  |
 |
| 3.00 | 100 | 0.1 | 5 |  |
 |
| 4.00 | 60 | 0.06 | 3 |  |
 |
| 5.00 | 50 | 0.05 | 2 |  |
 |
| 6.00 | 35 | 0.035 | 1 |  |
 |
| 7.00 | 20 | 0.02 | 0.5 |  |
 |
| 8.00 | 15 | 0.015 | 0.3 |  |
 |
| 9.00 | 10 | 0.01 | 0.2 |  |
 |
| 10.00 | 0 | 0 | 0 | |
 |
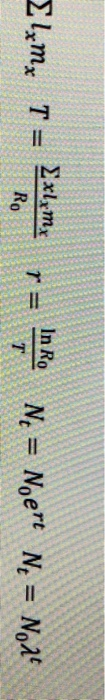
C.The net reproductive rate is the mean number of female
offsprings produced by a female during her lifetime. It is given by
the relation, 
The mean generation time is given by the relation,  ; now,

Per capita rate of increase is the change in population size per
individual per unit time and is given by the relation, 
Now, as the net reproductive rate, R0 > 1, so the population is increasing in size. The mean generation time, G is 2.555 years which means that the average age of females when they give birth to the offsprings is 2.555 years.
D. The survivorship curves is usually created by plotting lx on the y-axis and age on the x-axis. The above population shows type III survivorship curve, as very few of the organism survive their younger years which is evident from the data in the column of lx. The individuals those who have survived, live for long time. Species of this type of curve produce large number of offsprings at once.
E. The population is increasing, because, the net reproductive rate, R0 >1 and per capita rate of increase, r > 0. So it can be said that the population is increasing.
Add Answer to:
please i need your help a,b,c,d, e and F thank you
A. Please define the following...
As a professor of xenobiology, you and several of your students have traveled to the ice planet Hoth to study the ecology of wampas
 As a professor of xenobiology, you and several of your students have traveled to the ice planet Hoth to study the ecology of wampas (the picture on the right below). As an initial project, you decide to construct a life table for this ferocious predator. Below are the data you have gathered from the cohort born the year you arrived: (A) Using the information above, calculate the following values for this life table: (i) survivorship values, Lx (ii) mortality values, dx;...
please do 1 through 4. Thank you. 0 1. Fe 1.SCN Procedure B: 1. Prepare ICE...
 please do 1 through 4. Thank you.
0 1. Fe 1.SCN Procedure B: 1. Prepare ICE tables for beakers 2 - 6 using the example below as a guideline (you will have 5 different ICE tables). Table 3. Sample "ICE" table. Fe(aq)*3 + SCN(aq) = FeSCN2 Initial: **M calculated **M calculated using your Table 2 using your Table 2 volumes volumes Change: - 1x - 1x Equilibrium: M 1x 1x = concentration calculated from Procedure A slope-intercept equation +1x M...
please do 1 through 4. Thank you.
0 1. Fe 1.SCN Procedure B: 1. Prepare ICE tables for beakers 2 - 6 using the example below as a guideline (you will have 5 different ICE tables). Table 3. Sample "ICE" table. Fe(aq)*3 + SCN(aq) = FeSCN2 Initial: **M calculated **M calculated using your Table 2 using your Table 2 volumes volumes Change: - 1x - 1x Equilibrium: M 1x 1x = concentration calculated from Procedure A slope-intercept equation +1x M...
I need help with parts A B D E and F. Please show hand work for...
 I need help with parts A B D E and F. Please show hand work
for solving A and B while D and E should be matlab codes. How do i
pick the right graph for part F?
5 2 4 6 Linear spline: s fi+ (x-x) 2) Given the points 40 78 125 256 348 425 X1-x a) Write the correct linear spline equation to interpolate for x 4.72, simplifying where appropriate to get to the slope-intercept form. (4...
I need help with parts A B D E and F. Please show hand work
for solving A and B while D and E should be matlab codes. How do i
pick the right graph for part F?
5 2 4 6 Linear spline: s fi+ (x-x) 2) Given the points 40 78 125 256 348 425 X1-x a) Write the correct linear spline equation to interpolate for x 4.72, simplifying where appropriate to get to the slope-intercept form. (4...
need B C and D done please please please help!!! 1. You measure the initial rate...
 need B C and D done please please please help!!!
1. You measure the initial rate of an enzyme reaction as a function of substrate concentration in the presence and absence of an inhibitor. The following data was obtained: V. (-) Inhibitor (mm/min) (+) Inhibitor (mM/min) 17 [S] (MM) 0.0001 0.0002 0.0005 0.001 0.002 Please submit calculations and graph for full credit! Note: You are required to use Excel to generate the Lineweaver-Burk plot (a) (10 points) Create a Lineweaver-Burk...
need B C and D done please please please help!!!
1. You measure the initial rate of an enzyme reaction as a function of substrate concentration in the presence and absence of an inhibitor. The following data was obtained: V. (-) Inhibitor (mm/min) (+) Inhibitor (mM/min) 17 [S] (MM) 0.0001 0.0002 0.0005 0.001 0.002 Please submit calculations and graph for full credit! Note: You are required to use Excel to generate the Lineweaver-Burk plot (a) (10 points) Create a Lineweaver-Burk...
MA 321 Data Analysis PLEASE STATE EACH ANSWER A,B,C,D,E,F AS PICTURED X A study was conducted...
 MA 321 Data Analysis
PLEASE STATE EACH ANSWER A,B,C,D,E,F AS PICTURED
X
A study was conducted to examine the different hourly wages
offered to six students helpers in three different department
services here at the FIT. The data for this study, in which each
student works in each of the three departments, is shown in the
following table.
a)State the hypotheses for this study (8
points)
b) Using Excel, run the appropriate test
(Submit your Excel output)
c) (i) Make...
MA 321 Data Analysis
PLEASE STATE EACH ANSWER A,B,C,D,E,F AS PICTURED
X
A study was conducted to examine the different hourly wages
offered to six students helpers in three different department
services here at the FIT. The data for this study, in which each
student works in each of the three departments, is shown in the
following table.
a)State the hypotheses for this study (8
points)
b) Using Excel, run the appropriate test
(Submit your Excel output)
c) (i) Make...
Please help guide or explain how I would graph this? Thank you so much IV. Data...
 Please help guide or explain how I would graph this? Thank you
so much
IV. Data Table • Fill in the remaining columns on your data table. Calculate the solubility at each temperature by dividing the mass of KNO, used by the volume of solution at that temperature. (Watch sig tig! V. Graphing the data - Temperature (°C) on the x-axis and Solubility (g KNO/mL solution) on the y-axis • Orient graph paper as noted "up" with long dimension on...
Please help guide or explain how I would graph this? Thank you
so much
IV. Data Table • Fill in the remaining columns on your data table. Calculate the solubility at each temperature by dividing the mass of KNO, used by the volume of solution at that temperature. (Watch sig tig! V. Graphing the data - Temperature (°C) on the x-axis and Solubility (g KNO/mL solution) on the y-axis • Orient graph paper as noted "up" with long dimension on...
I need help with a-e but please focus on d and e. Thank you! You are...
 I need help with a-e but please focus on d and e.
Thank you!
You are a staff accountant at a confectionary company, Philly Chocolates International the Company" or PCI). The lease on the current multifunction copiers the Company has in its headquarters is almost up PCI has decided to replace the current copiers with Canon imageRunnerAdvanceC55501 copiers. The CFO has asked you to investigate the impact to the financial statements over the next five years if PCI buys the...
I need help with a-e but please focus on d and e.
Thank you!
You are a staff accountant at a confectionary company, Philly Chocolates International the Company" or PCI). The lease on the current multifunction copiers the Company has in its headquarters is almost up PCI has decided to replace the current copiers with Canon imageRunnerAdvanceC55501 copiers. The CFO has asked you to investigate the impact to the financial statements over the next five years if PCI buys the...
please help with ALL questions thank you 1. Using excel, plot your standard curve based on...
 please help with ALL questions thank you
1. Using excel, plot your standard curve based on Table 9-1 and calculate the line of best fit. Put concentration in the x column and OD in the y to solve for the concentrations of your unknown in Table 9-3. Report the slope and the y-intercept below. (1 mark) Slope (m) = v-intercept(b) = 2. Can this standard curve for yeast cells be used for cali cells (why/ why not?) (2 marks) 3....
please help with ALL questions thank you
1. Using excel, plot your standard curve based on Table 9-1 and calculate the line of best fit. Put concentration in the x column and OD in the y to solve for the concentrations of your unknown in Table 9-3. Report the slope and the y-intercept below. (1 mark) Slope (m) = v-intercept(b) = 2. Can this standard curve for yeast cells be used for cali cells (why/ why not?) (2 marks) 3....
I wonder only both (d) and (e). If you use excel, please show what you do exactly. Please help me. Thanks. ts) Can-Do Canoe sells lightweight portable canoes. Quarterly demand for its most 2. (70...
 I wonder only both (d) and (e).
If you use excel, please show what you do exactly.
Please help me. Thanks.
ts) Can-Do Canoe sells lightweight portable canoes. Quarterly demand for its most 2. (70 point ar product family over the past 3 years has been as follows. popul 2015 2 2016 2 2017 Year Demand 25 120 40 60 30 140 608035 150 55 90 4 Quarter a) (10 points) Use an exponential smoothing model with smoothing constant a...
I wonder only both (d) and (e).
If you use excel, please show what you do exactly.
Please help me. Thanks.
ts) Can-Do Canoe sells lightweight portable canoes. Quarterly demand for its most 2. (70 point ar product family over the past 3 years has been as follows. popul 2015 2 2016 2 2017 Year Demand 25 120 40 60 30 140 608035 150 55 90 4 Quarter a) (10 points) Use an exponential smoothing model with smoothing constant a...
Need help with parts C, D, E, F and J please and thank you! ei The...
 Need help with parts C, D, E, F and J please and thank
you!
ei The cost of a leading liquid laundry detergent in different sizes is given below. Size (ounces) Cost (5) 16 3.29 32 429 64 5.29 200 10.19 Part Parti Parte Call the last sein. Put the gation in the form of a bw. Round your answers to three decimal places) Part Find the correlation contr. (Round your answer to four decimal places) Is it can •...
Need help with parts C, D, E, F and J please and thank
you!
ei The cost of a leading liquid laundry detergent in different sizes is given below. Size (ounces) Cost (5) 16 3.29 32 429 64 5.29 200 10.19 Part Parti Parte Call the last sein. Put the gation in the form of a bw. Round your answers to three decimal places) Part Find the correlation contr. (Round your answer to four decimal places) Is it can •...
 please do 1 through 4. Thank you.
0 1. Fe 1.SCN Procedure B: 1. Prepare ICE tables for beakers 2 - 6 using the example below as a guideline (you will have 5 different ICE tables). Table 3. Sample "ICE" table. Fe(aq)*3 + SCN(aq) = FeSCN2 Initial: **M calculated **M calculated using your Table 2 using your Table 2 volumes volumes Change: - 1x - 1x Equilibrium: M 1x 1x = concentration calculated from Procedure A slope-intercept equation +1x M...
please do 1 through 4. Thank you.
0 1. Fe 1.SCN Procedure B: 1. Prepare ICE tables for beakers 2 - 6 using the example below as a guideline (you will have 5 different ICE tables). Table 3. Sample "ICE" table. Fe(aq)*3 + SCN(aq) = FeSCN2 Initial: **M calculated **M calculated using your Table 2 using your Table 2 volumes volumes Change: - 1x - 1x Equilibrium: M 1x 1x = concentration calculated from Procedure A slope-intercept equation +1x M...
 I need help with parts A B D E and F. Please show hand work
for solving A and B while D and E should be matlab codes. How do i
pick the right graph for part F?
5 2 4 6 Linear spline: s fi+ (x-x) 2) Given the points 40 78 125 256 348 425 X1-x a) Write the correct linear spline equation to interpolate for x 4.72, simplifying where appropriate to get to the slope-intercept form. (4...
I need help with parts A B D E and F. Please show hand work
for solving A and B while D and E should be matlab codes. How do i
pick the right graph for part F?
5 2 4 6 Linear spline: s fi+ (x-x) 2) Given the points 40 78 125 256 348 425 X1-x a) Write the correct linear spline equation to interpolate for x 4.72, simplifying where appropriate to get to the slope-intercept form. (4...
 need B C and D done please please please help!!!
1. You measure the initial rate of an enzyme reaction as a function of substrate concentration in the presence and absence of an inhibitor. The following data was obtained: V. (-) Inhibitor (mm/min) (+) Inhibitor (mM/min) 17 [S] (MM) 0.0001 0.0002 0.0005 0.001 0.002 Please submit calculations and graph for full credit! Note: You are required to use Excel to generate the Lineweaver-Burk plot (a) (10 points) Create a Lineweaver-Burk...
need B C and D done please please please help!!!
1. You measure the initial rate of an enzyme reaction as a function of substrate concentration in the presence and absence of an inhibitor. The following data was obtained: V. (-) Inhibitor (mm/min) (+) Inhibitor (mM/min) 17 [S] (MM) 0.0001 0.0002 0.0005 0.001 0.002 Please submit calculations and graph for full credit! Note: You are required to use Excel to generate the Lineweaver-Burk plot (a) (10 points) Create a Lineweaver-Burk...
 MA 321 Data Analysis
PLEASE STATE EACH ANSWER A,B,C,D,E,F AS PICTURED
X
A study was conducted to examine the different hourly wages
offered to six students helpers in three different department
services here at the FIT. The data for this study, in which each
student works in each of the three departments, is shown in the
following table.
a)State the hypotheses for this study (8
points)
b) Using Excel, run the appropriate test
(Submit your Excel output)
c) (i) Make...
MA 321 Data Analysis
PLEASE STATE EACH ANSWER A,B,C,D,E,F AS PICTURED
X
A study was conducted to examine the different hourly wages
offered to six students helpers in three different department
services here at the FIT. The data for this study, in which each
student works in each of the three departments, is shown in the
following table.
a)State the hypotheses for this study (8
points)
b) Using Excel, run the appropriate test
(Submit your Excel output)
c) (i) Make...
 Please help guide or explain how I would graph this? Thank you
so much
IV. Data Table • Fill in the remaining columns on your data table. Calculate the solubility at each temperature by dividing the mass of KNO, used by the volume of solution at that temperature. (Watch sig tig! V. Graphing the data - Temperature (°C) on the x-axis and Solubility (g KNO/mL solution) on the y-axis • Orient graph paper as noted "up" with long dimension on...
Please help guide or explain how I would graph this? Thank you
so much
IV. Data Table • Fill in the remaining columns on your data table. Calculate the solubility at each temperature by dividing the mass of KNO, used by the volume of solution at that temperature. (Watch sig tig! V. Graphing the data - Temperature (°C) on the x-axis and Solubility (g KNO/mL solution) on the y-axis • Orient graph paper as noted "up" with long dimension on...
 I need help with a-e but please focus on d and e.
Thank you!
You are a staff accountant at a confectionary company, Philly Chocolates International the Company" or PCI). The lease on the current multifunction copiers the Company has in its headquarters is almost up PCI has decided to replace the current copiers with Canon imageRunnerAdvanceC55501 copiers. The CFO has asked you to investigate the impact to the financial statements over the next five years if PCI buys the...
I need help with a-e but please focus on d and e.
Thank you!
You are a staff accountant at a confectionary company, Philly Chocolates International the Company" or PCI). The lease on the current multifunction copiers the Company has in its headquarters is almost up PCI has decided to replace the current copiers with Canon imageRunnerAdvanceC55501 copiers. The CFO has asked you to investigate the impact to the financial statements over the next five years if PCI buys the...
 please help with ALL questions thank you
1. Using excel, plot your standard curve based on Table 9-1 and calculate the line of best fit. Put concentration in the x column and OD in the y to solve for the concentrations of your unknown in Table 9-3. Report the slope and the y-intercept below. (1 mark) Slope (m) = v-intercept(b) = 2. Can this standard curve for yeast cells be used for cali cells (why/ why not?) (2 marks) 3....
please help with ALL questions thank you
1. Using excel, plot your standard curve based on Table 9-1 and calculate the line of best fit. Put concentration in the x column and OD in the y to solve for the concentrations of your unknown in Table 9-3. Report the slope and the y-intercept below. (1 mark) Slope (m) = v-intercept(b) = 2. Can this standard curve for yeast cells be used for cali cells (why/ why not?) (2 marks) 3....
 I wonder only both (d) and (e).
If you use excel, please show what you do exactly.
Please help me. Thanks.
ts) Can-Do Canoe sells lightweight portable canoes. Quarterly demand for its most 2. (70 point ar product family over the past 3 years has been as follows. popul 2015 2 2016 2 2017 Year Demand 25 120 40 60 30 140 608035 150 55 90 4 Quarter a) (10 points) Use an exponential smoothing model with smoothing constant a...
I wonder only both (d) and (e).
If you use excel, please show what you do exactly.
Please help me. Thanks.
ts) Can-Do Canoe sells lightweight portable canoes. Quarterly demand for its most 2. (70 point ar product family over the past 3 years has been as follows. popul 2015 2 2016 2 2017 Year Demand 25 120 40 60 30 140 608035 150 55 90 4 Quarter a) (10 points) Use an exponential smoothing model with smoothing constant a...
 Need help with parts C, D, E, F and J please and thank
you!
ei The cost of a leading liquid laundry detergent in different sizes is given below. Size (ounces) Cost (5) 16 3.29 32 429 64 5.29 200 10.19 Part Parti Parte Call the last sein. Put the gation in the form of a bw. Round your answers to three decimal places) Part Find the correlation contr. (Round your answer to four decimal places) Is it can •...
Need help with parts C, D, E, F and J please and thank
you!
ei The cost of a leading liquid laundry detergent in different sizes is given below. Size (ounces) Cost (5) 16 3.29 32 429 64 5.29 200 10.19 Part Parti Parte Call the last sein. Put the gation in the form of a bw. Round your answers to three decimal places) Part Find the correlation contr. (Round your answer to four decimal places) Is it can •...
Most questions answered within 3 hours.
-
Minitab Problem: Take the Lake Hume June rainfall data and find
use the processes outlined in...
asked 43 minutes ago -
X Company is trying to decide whether to continue using old
equipment to make Product A...
asked 44 minutes ago -
IN PYTHON ONLY !! Program 2: Re-work
program #5 (WeeklyHours) from the previous assignment such that...
asked 1 hour ago -
The average length of time between arrivals at a turnpike
toll-booth is 26 seconds. What is...
asked 3 hours ago -
(a) A piston at 6.1 atm contains a gas that occupies a volume of
3.5 L....
asked 4 hours ago -
Please answer true or false. Words
cannot be changed or added in to make it true...
asked 4 hours ago -
An empty test tube weighs 15.923 grams. Then,
MgCl2•6H2O is added into the test tube. After...
asked 4 hours ago -
Assume memory access is 10 units of time and disk access is
10000 units of time....
asked 4 hours ago -
1. Are all good samples random?
2. Magazines often report surveys giving statistics such as “63%...
asked 4 hours ago -
Under all the various types of market structures, firms
must eventually earn some economic profits for...
asked 4 hours ago -
Consider the following fitness regime for a single locus trait
with two co-dominant alleles: w11 =...
asked 4 hours ago -
A large cable company reports the following.
80% of its customers subscribe to its cable TV...
asked 4 hours ago