
Homework Answers

Add Answer to:
g) The Bode magnitude plot of a system is given below (note gains are in dB...
A bode plot of the transfer function, GS = - 25 $2+45+25, is shown as below....
 A bode plot of the transfer function, GS = - 25 $2+45+25, is shown as below. Bode Diagram System sys Frequency (rad/s): 7 Magnitude (dB): -3.4 Magnitude (dB) Phase (deg) Systemt sys Frequency (rad/s): 7 Phase (deg): - 130 - 135 - 180 10 Frequency (rad/s) Determine the frequency response y(t) when a sinusoidal function, X(t) = 10 sin (7t +30) is applied to the transfer function as an input signal. (20 points)
The Bode magnitude plot of H(o) is shown Find H(w) 0.1 10 ? (rad/s) +20 dB/decade...
 The Bode magnitude plot of H(o) is shown Find H(w) 0.1 10 ? (rad/s) +20 dB/decade -40 dB/decade
Determine DC gain and crossover frequency from the following Bode plots. Magnitude (dB) Phase (deg) -180...
 Determine DC gain and crossover frequency from the following Bode plots. Magnitude (dB) Phase (deg) -180 10-1 100 103 10 Frequency (rad/s) DC gain = 10.8, cr = 1.2 rad/s DC gain = 2.5, wc = 4.2 rad/s DC gain = 5.0 dB, -2.5 rad/s • DC gain = 1.8 dB, -2.1 rad/
Hw 10 Problem 2 2. Draw the magnitude characteristic of the Bode plot of the following...
 Hw 10 Problem 2 2. Draw the magnitude characteristic of the Bode plot of the following transfer function: HG) = (s +5)(s +10) 5 + 5 + 10) a) Identify the poles and zeros. Enter values beginning with the poles and zeros whose real parts are closest to the origin in the complex plane. b) Identify the breakpoint frequencies. Enter the breakpoints in increasing order. c) Express the transfer function in the standard form: H(S) = (Tpis + 1)(Tp25 +...
12.18 Find the transfer function G(0) using the Bode magnitude plot shown below. Hw G/dB) -20...
 12.18 Find the transfer function G(0) using the Bode magnitude plot shown below. Hw G/dB) -20 dB/decade 40 20 100 20 (rad/s) Figure P12.18 12.26 For the following circuit determine the resonant frequency and quality factor. c = 10 nF 2mA R,2k L0.1 mH c
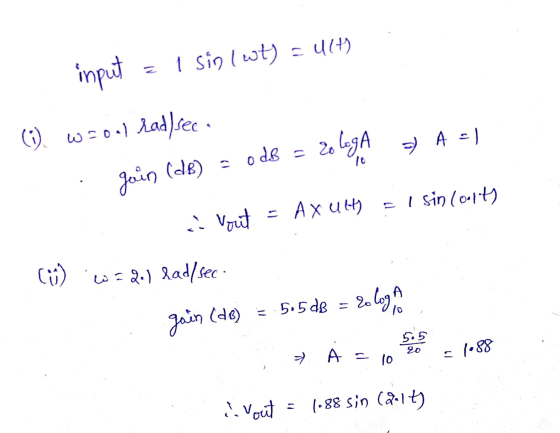
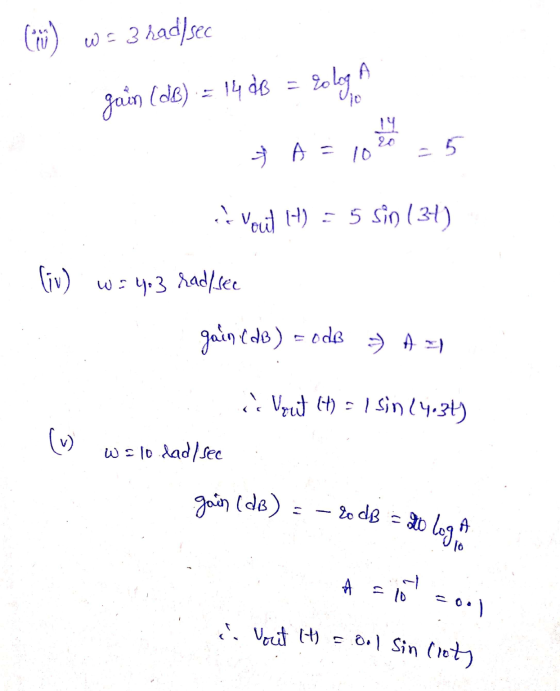
Please do 765 Hamad Alrobayan 1dvn the system in Fig 765 with corresponding asymptotic Bode-gain plot. 3 gldB-9 nput amplitude at w2 is A and output amplitude is B. Find B Only one numerical answ...
 Please do 765
Hamad Alrobayan 1dvn the system in Fig 765 with corresponding asymptotic Bode-gain plot. 3 gldB-9 nput amplitude at w2 is A and output amplitude is B. Find B Only one numerical answer is required. ans:3 dB, w1-4 rad/sec, w2-12 rad/sec, and A- 3 volts. The system 1 Hamad Alrobayan R4-6 (al1 ohms) and 577) Refer to Figure 577. R1-2 R2-5 R3-9 C1- Fd C2-9 Fd. Determine 9 the transfer function v2 (s)/v1 (s)As/(s 2+Bs+D). Answers: A, B,D....
Please do 765
Hamad Alrobayan 1dvn the system in Fig 765 with corresponding asymptotic Bode-gain plot. 3 gldB-9 nput amplitude at w2 is A and output amplitude is B. Find B Only one numerical answer is required. ans:3 dB, w1-4 rad/sec, w2-12 rad/sec, and A- 3 volts. The system 1 Hamad Alrobayan R4-6 (al1 ohms) and 577) Refer to Figure 577. R1-2 R2-5 R3-9 C1- Fd C2-9 Fd. Determine 9 the transfer function v2 (s)/v1 (s)As/(s 2+Bs+D). Answers: A, B,D....
Chapter 12, Problem 12.21 (Multistep) Part 1 Correct. Sketch the magnitude characteristic of the Bode plot...
 Chapter 12, Problem 12.21 (Multistep) Part 1 Correct. Sketch the magnitude characteristic of the Bode plot for the transfer function 30(0.060 * jo + 1) jojo + 1)(0.0024 * ja + 1) H0) = Shown here is the radian frequency axis for w > 0. The labeled frequencies represent the break frequencies in the transfer function H(o) (not necessarily drawn to scale). -+ W + w W3 W (rad/sec) What are the numerical values of the break frequencies w1, wz,...
4. Sketch the Bode magnitude plot ofa fiter having a transfer function 10's H(s)- (s+500) (s+S0s+...
 4. Sketch the Bode magnitude plot ofa fiter having a transfer function 10's H(s)- (s+500) (s+S0s+2500) he following senilog graph to sketch yo ur plot (and please scale the eequeney axis proper a) Please use t receive full credits) b) What kind of filter is it and why? read the approximate 3-dB cut-off frequencies of the filter From your plot ont is the asrsximate.ostt of the filter due to an input, st)- 2sin(400)-3os(10 a) c) frequency axis properly a) Please...
How to Sketch a bode plot for the transfer function given below indicating approximate amplitudes, slopes...
 How to Sketch a bode plot for the transfer function given below
indicating approximate amplitudes, slopes (in dB/decade) and
frequency values (in Hertz).
(s? +4) (52 +220 + 4000)
How to Sketch a bode plot for the transfer function given below
indicating approximate amplitudes, slopes (in dB/decade) and
frequency values (in Hertz).
(s? +4) (52 +220 + 4000)
a. For the following Bode diagram, determine: Bode Diagram (7 marks Magnitude (dB) Phase (deg! Frequency...
 a. For the following Bode diagram, determine: Bode Diagram (7 marks Magnitude (dB) Phase (deg! Frequency (rad/s! 1. The gain margin. 2. The phase margin. 3. Gain crossover frequency. 4. Phase crossover frequency. 5. Comment on the stability of this system.
 A bode plot of the transfer function, GS = - 25 $2+45+25, is shown as below. Bode Diagram System sys Frequency (rad/s): 7 Magnitude (dB): -3.4 Magnitude (dB) Phase (deg) Systemt sys Frequency (rad/s): 7 Phase (deg): - 130 - 135 - 180 10 Frequency (rad/s) Determine the frequency response y(t) when a sinusoidal function, X(t) = 10 sin (7t +30) is applied to the transfer function as an input signal. (20 points)
 The Bode magnitude plot of H(o) is shown Find H(w) 0.1 10 ? (rad/s) +20 dB/decade -40 dB/decade
 Determine DC gain and crossover frequency from the following Bode plots. Magnitude (dB) Phase (deg) -180 10-1 100 103 10 Frequency (rad/s) DC gain = 10.8, cr = 1.2 rad/s DC gain = 2.5, wc = 4.2 rad/s DC gain = 5.0 dB, -2.5 rad/s • DC gain = 1.8 dB, -2.1 rad/
 Hw 10 Problem 2 2. Draw the magnitude characteristic of the Bode plot of the following transfer function: HG) = (s +5)(s +10) 5 + 5 + 10) a) Identify the poles and zeros. Enter values beginning with the poles and zeros whose real parts are closest to the origin in the complex plane. b) Identify the breakpoint frequencies. Enter the breakpoints in increasing order. c) Express the transfer function in the standard form: H(S) = (Tpis + 1)(Tp25 +...
 12.18 Find the transfer function G(0) using the Bode magnitude plot shown below. Hw G/dB) -20 dB/decade 40 20 100 20 (rad/s) Figure P12.18 12.26 For the following circuit determine the resonant frequency and quality factor. c = 10 nF 2mA R,2k L0.1 mH c
 Please do 765
Hamad Alrobayan 1dvn the system in Fig 765 with corresponding asymptotic Bode-gain plot. 3 gldB-9 nput amplitude at w2 is A and output amplitude is B. Find B Only one numerical answer is required. ans:3 dB, w1-4 rad/sec, w2-12 rad/sec, and A- 3 volts. The system 1 Hamad Alrobayan R4-6 (al1 ohms) and 577) Refer to Figure 577. R1-2 R2-5 R3-9 C1- Fd C2-9 Fd. Determine 9 the transfer function v2 (s)/v1 (s)As/(s 2+Bs+D). Answers: A, B,D....
Please do 765
Hamad Alrobayan 1dvn the system in Fig 765 with corresponding asymptotic Bode-gain plot. 3 gldB-9 nput amplitude at w2 is A and output amplitude is B. Find B Only one numerical answer is required. ans:3 dB, w1-4 rad/sec, w2-12 rad/sec, and A- 3 volts. The system 1 Hamad Alrobayan R4-6 (al1 ohms) and 577) Refer to Figure 577. R1-2 R2-5 R3-9 C1- Fd C2-9 Fd. Determine 9 the transfer function v2 (s)/v1 (s)As/(s 2+Bs+D). Answers: A, B,D....
 Chapter 12, Problem 12.21 (Multistep) Part 1 Correct. Sketch the magnitude characteristic of the Bode plot for the transfer function 30(0.060 * jo + 1) jojo + 1)(0.0024 * ja + 1) H0) = Shown here is the radian frequency axis for w > 0. The labeled frequencies represent the break frequencies in the transfer function H(o) (not necessarily drawn to scale). -+ W + w W3 W (rad/sec) What are the numerical values of the break frequencies w1, wz,...
 4. Sketch the Bode magnitude plot ofa fiter having a transfer function 10's H(s)- (s+500) (s+S0s+2500) he following senilog graph to sketch yo ur plot (and please scale the eequeney axis proper a) Please use t receive full credits) b) What kind of filter is it and why? read the approximate 3-dB cut-off frequencies of the filter From your plot ont is the asrsximate.ostt of the filter due to an input, st)- 2sin(400)-3os(10 a) c) frequency axis properly a) Please...
 How to Sketch a bode plot for the transfer function given below
indicating approximate amplitudes, slopes (in dB/decade) and
frequency values (in Hertz).
(s? +4) (52 +220 + 4000)
How to Sketch a bode plot for the transfer function given below
indicating approximate amplitudes, slopes (in dB/decade) and
frequency values (in Hertz).
(s? +4) (52 +220 + 4000)
 a. For the following Bode diagram, determine: Bode Diagram (7 marks Magnitude (dB) Phase (deg! Frequency (rad/s! 1. The gain margin. 2. The phase margin. 3. Gain crossover frequency. 4. Phase crossover frequency. 5. Comment on the stability of this system.
Most questions answered within 3 hours.
-
PLEASE do not use any loops for the program; only recursion is
allowed
4. Write a...
asked 15 minutes ago -
Please help me with me. I did the first part to write the operations but in...
asked 12 minutes ago -
A nozzle with a radius of 0.250 cm is attached to a garden hose
with a...
asked 6 minutes ago -
Use Cryptool to find the Cryptographic SHA-1 hash value of the
string "abc". The calculator is...
asked 16 minutes ago -
You are attempting to calculate a firm’s free cash flow to
equity. You know the following...
asked 1 hour ago -
the following reaction occurs in a balloon containing
N2O2 gas
N2O4(g)=2NO2(g)
will the volume of the...
asked 1 hour ago -
answer the questions throughout this program
public class Day implements Comparable {
Private Boolean atWork;...
asked 1 hour ago -
This is C++ code for parking fee management program
#include <iostream>
#include <iomanip>
using namespace std;...
asked 2 hours ago -
The free energy change for the following reaction at 25 °C, when
[Sn2+] = 1.17 M...
asked 3 hours ago -
An MNE is this kind of industry when competition in one country
is essentially independent of...
asked 5 hours ago -
. For this set of questions, determine what
proportion of a normal distribution is located betweeneach...
asked 5 hours ago -
A college student is employed as a door-to-door newspaper
salesman. Historical data suggests that the student...
asked 6 hours ago