
Homework Answers

Add Answer to:
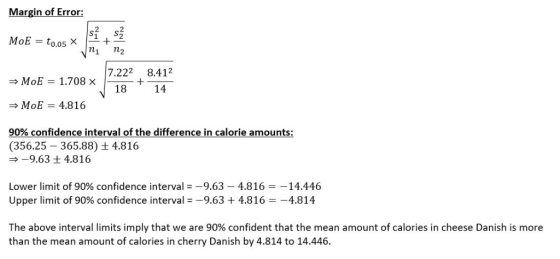
7. Pierre's is interested in comparing the calorie amounts of its cherry and cheese Danish. A...
A researcher was interested in comparing the heights of ninjas in two independent villages
A researcher was interested in comparing the heights of ninjas in two independent villages. A random sample of 9 ninjas from the Hidden Leaf Village has an average height of 64.744 inches, with a standard deviation of 2.192 inches. A random sample of 9 ninjas from the Hidden Sand Village has an average height of 62.556 inches, with a standard deviation of 2.697 inches. Determine a 90% confidence interval for the difference between the mean height of ninjas in the...
7. A group of university students are interested in comparing the average age of cars owned...
 7. A group of university students are interested in comparing the average age of cars owned by students and the average age of cars owned by faculty. They randomly selected 25 cars that are own by students and 20 cars that are owned by faculty. The average age and standard deviation obtained from the students' cars are 6.78 years and 5.21 years, respectively. The sample of faculty cars produced a mean and a standard deviation of 5.86 years, and 2.72....
Chipotle Mexican Grill must post its calorie information for all of its menu selections. It takes...
Chipotle Mexican Grill must post its calorie information for all of its menu selections. It takes a sample of 100 chicken burritos and determines that the average calorie count for a chicken burrito is 1040 calories with standard deviation of 140 calories. 6) What is the value of t to achieve 95% confidence in the number of calories in a chicken burrito? 7) What is the 95% confidence interval? 8) If the menu currently shows 980 calories for a chicken...
A researcher compares the effectiveness of two different instructional methods for teaching pharmacology. A sample of...
A researcher compares the effectiveness of two different instructional methods for teaching pharmacology. A sample of 51 students using Method 1 produces a testing average of 81.6. A sample of 76 students using Method 2 produces a testing average of 76.4. Assume that the population standard deviation for Method 1 is 12.24, while the population standard deviation for Method 2 is 11.19. Determine the 90% confidence interval for the true difference between testing averages for students using Method 1 and...
please show work and/or sketch of graph. Thanks A popular online retail website was interested in...
 please show work and/or sketch of graph. Thanks
A popular online retail website was interested in consumer spending during the holiday shopping weekend after Thanksgiving. They collect data on a random sample of 400 shoppers, particularly noting how much money each shopper spent. The following histogram was constructed using the data: 50 100 200 250 300 150 Spending The retailer determines that this sample had an average of $84.71 with a standard deviation of $46.87. a. (1 point) What is...
please show work and/or sketch of graph. Thanks
A popular online retail website was interested in consumer spending during the holiday shopping weekend after Thanksgiving. They collect data on a random sample of 400 shoppers, particularly noting how much money each shopper spent. The following histogram was constructed using the data: 50 100 200 250 300 150 Spending The retailer determines that this sample had an average of $84.71 with a standard deviation of $46.87. a. (1 point) What is...
The state education commission wants to estimate the fraction of tenth grade students that have reading...
The state education commission wants to estimate the fraction of tenth grade students that have reading skills at or below the eighth grade level. Step 1 of 2: Suppose a sample of 16491649 tenth graders is drawn. Of the students sampled, 379379 read at or below the eighth grade level. Using the data, estimate the proportion of tenth graders reading at or below the eighth grade level. Enter your answer as a fraction or a decimal number rounded to three...
A taxi company is interested in the amount of time its vehicles are out of operation...
A taxi company is interested in the amount of time its vehicles are out of operation for repair. Find a 90% confidence interval for the mean number of days in a month that all taxis are out of operation for repair. A random sample of nine taxis had the following number of days that each was in repair (Note that we are using sample data and must estimate the sample standard deviation using the sample formula.): 10 16 19 14...
The average expenditure on Valentine's Day was expected to be $100.89 (USA Today, February 13, 2006)....
 The average expenditure on Valentine's Day was expected to be $100.89 (USA Today, February 13, 2006). Do male and female consumers differ in the amounts they spend? The average expenditure in a sample survey of 48 male consumers was $139.5, and the average expenditure in a sample survey of 37 female consumers was $65.76. Based on past surveys, the standard deviation for male consumers is assumed to be $35, and the standard deviation for female consumers is assumed to be...
4. Suppose a researcher, interested in obtaining an estimate of the average level of some enzyme...
 4. Suppose a researcher, interested in obtaining an estimate of the average level of some enzyme in a certain human population, takes a sample of 36 individuals, determines the level of the enzyme in each, and computes a sample mean of 22. Suppose further it is known that the variable of interest is approximately normally distributed with a variance of 45. Give a 96% confidence interval of population mean 5. Suppose we find that, the average engine size in our...
 7. A group of university students are interested in comparing the average age of cars owned by students and the average age of cars owned by faculty. They randomly selected 25 cars that are own by students and 20 cars that are owned by faculty. The average age and standard deviation obtained from the students' cars are 6.78 years and 5.21 years, respectively. The sample of faculty cars produced a mean and a standard deviation of 5.86 years, and 2.72....
 please show work and/or sketch of graph. Thanks
A popular online retail website was interested in consumer spending during the holiday shopping weekend after Thanksgiving. They collect data on a random sample of 400 shoppers, particularly noting how much money each shopper spent. The following histogram was constructed using the data: 50 100 200 250 300 150 Spending The retailer determines that this sample had an average of $84.71 with a standard deviation of $46.87. a. (1 point) What is...
please show work and/or sketch of graph. Thanks
A popular online retail website was interested in consumer spending during the holiday shopping weekend after Thanksgiving. They collect data on a random sample of 400 shoppers, particularly noting how much money each shopper spent. The following histogram was constructed using the data: 50 100 200 250 300 150 Spending The retailer determines that this sample had an average of $84.71 with a standard deviation of $46.87. a. (1 point) What is...
 The average expenditure on Valentine's Day was expected to be $100.89 (USA Today, February 13, 2006). Do male and female consumers differ in the amounts they spend? The average expenditure in a sample survey of 48 male consumers was $139.5, and the average expenditure in a sample survey of 37 female consumers was $65.76. Based on past surveys, the standard deviation for male consumers is assumed to be $35, and the standard deviation for female consumers is assumed to be...
 4. Suppose a researcher, interested in obtaining an estimate of the average level of some enzyme in a certain human population, takes a sample of 36 individuals, determines the level of the enzyme in each, and computes a sample mean of 22. Suppose further it is known that the variable of interest is approximately normally distributed with a variance of 45. Give a 96% confidence interval of population mean 5. Suppose we find that, the average engine size in our...
Most questions answered within 3 hours.
-
A sock stuck to the side of a clothes-dryer barrel has a
centripetal acceleration of 24...
asked 38 minutes ago -
A perfect gas undergoes an isentropic process such that its
volume doubles. If the ratio of...
asked 58 minutes ago -
list the elements in groups 3A to 6A in the same order as in the
periodic...
asked 1 hour ago -
Estimating effect size. Peng and Chen (2014)
evaluated effect size estimates for various tests. In their...
asked 1 hour ago -
Write a script in MySQL that creates and calls a stored
procedure name test. This procedure...
asked 1 hour ago -
If we test the following: H0: μ = 17
vs. H1: μ ≠ 17 and the...
asked 1 hour ago -
in the past year TVG had revenues of 3 million, cost
of goods sold of $25...
asked 1 hour ago -
4) In a polypeptide, which bond cannot rotate because of its
partial double bond character?
The...
asked 2 hours ago -
Assume that in the short run L = 1,000 and K = 100. 1. What is...
asked 2 hours ago -
At a given temperature, 2.06 atm of H2 and 3.7 atm of Br2 are
mixed and...
asked 2 hours ago -
Sodium reacts with Hydrochloric acid to form sodium chloride and
hydrogen gas. 2Na(s)+ 2 HCl(aq)-> 2...
asked 2 hours ago -
The following circuits (1 & 2) are combined to form a
series-parallel circuit and resulting circuit...
asked 2 hours ago