
Homework Answers


Add Answer to:
Chapter 8, Section 2, Exercise 042 Consider the data with analysis shown in the following computer...
Level N Mean StDev A 6 10.300 2.700 B 5 16.800 2.168 C 4 10.800 2.387...
Level N Mean StDev A 6 10.300 2.700 B 5 16.800 2.168 C 4 10.800 2.387 Source DF SS MS F P Groups 2 132.92, 66.46, 11.02 0.002 Error 12 72.34 6.03 Total 14 205.26 What is the pooled standard deviation? What degrees of freedom are used in doing inferences for these means and differences in means? Round your answer for the pooled standard deviation to two decimal places. The pooled standard deviation is = . degrees of freedom =
Consider the data with analysis shown in the following computer output: Level N Mean StDev A...
Consider the data with analysis shown in the following computer output: Level N Mean StDev A 4 10.000 3.159 B 5 16.800 2.168 C 6 10.800 2.387 Source DF SS MS F P Groups 2 134.72 67.36 10.46 0.002 Error 12 77.23 6.44 Total 14 211.95 Is there sufficient evidence of a difference in the population means of the three groups? Yes No
ES Consider the data with analysis shown in the following computer output: Mean StDev 6 9.900...
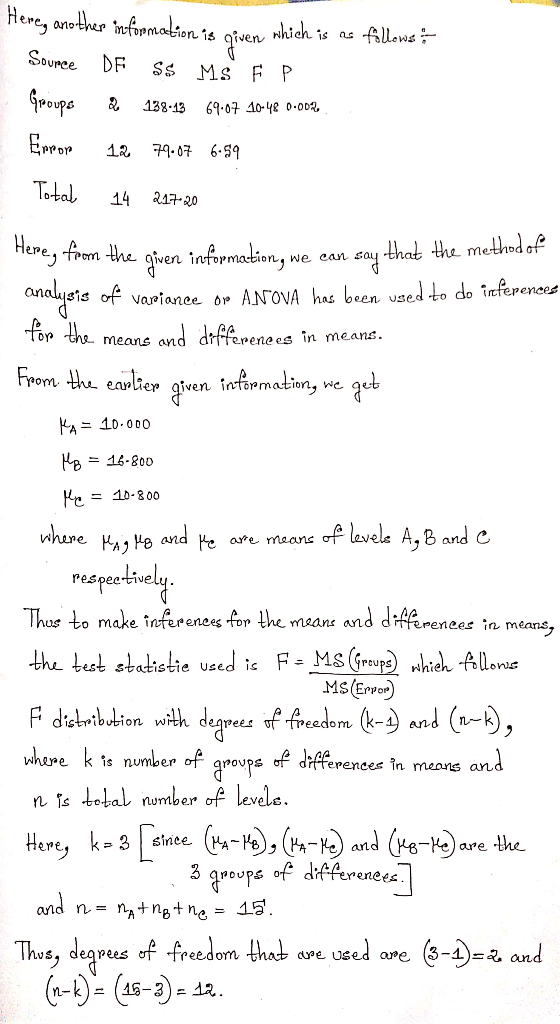
 ES Consider the data with analysis shown in the following computer output: Mean StDev 6 9.900 2.475 5 16.800 2.168 4 10.800 2.387 Source DF SS MS 2 139.86 69.93 10.74 0.002 Groups 12 78.12 6.51 Error 14 217.98 Total Is there sufficient evidence of a difference in the population means of the three groups?
5. Consider the data with analysis shown in the following computer output: Level N Mean StDev...
5. Consider the data with analysis shown in the following computer output: Level N Mean StDev A 4 10.400 2.668 B 5 16.800 2.168 C 6 10.800 2.387 Source DF SS MS F P Groups 2 126.88 63.44 11.09 0.002 Error 12 68.64 5.72 Total 14 195.52 Find a 95% confidence interval for the mean of population A. Round your answers to two decimal places.
 ES Consider the data with analysis shown in the following computer output: Mean StDev 6 9.900 2.475 5 16.800 2.168 4 10.800 2.387 Source DF SS MS 2 139.86 69.93 10.74 0.002 Groups 12 78.12 6.51 Error 14 217.98 Total Is there sufficient evidence of a difference in the population means of the three groups?
Most questions answered within 3 hours.
-
The manager at a car assembly plant believes that the mean
assembly time for a car...
asked 11 minutes ago -
Which of the following is true of electron capture?
A) It decreases the nuclide's mass number...
asked 1 hour ago -
Assuming an efficiency of 43.10%, calculate the actual yield of
magnesium nitrate formed from 114.9 g...
asked 2 hours ago -
The highly pathogenic bacterium Clostridium
perfringens causes gangrene, a disease that results in the
destruction of...
asked 4 hours ago -
In the context of situation analysis, which of the following is
a category for analysis in...
asked 4 hours ago -
In a study of the gas phase decomposition of sulfuryl chloride
at 600 K SO2Cl2(g)SO2(g) +...
asked 4 hours ago -
75 g of 2-propanol (C3H8O) and 25 g of pentane are mixed in a
200 mL...
asked 4 hours ago -
The 2800-turn coil in a dc motor has an area per turn of 1.1 ×
10-2...
asked 4 hours ago -
Draw a combinational logic circuit diagram with a symbol inside
the box for two I/P of...
asked 4 hours ago -
The cliché we use quite a lot in finance is: there is a need to
maximize...
asked 4 hours ago -
In class we discussed the addition of HCl to alpha pinene. Would
you expect one or...
asked 4 hours ago -
I'm trying to explain to my daughter to help her please help
me
I tagged the...
asked 4 hours ago