Excel Problem (to be used with the data in the Excel file):
Namata Appliances sells refrigerators. The model seen in the data file is relatively inexpensive. Weekly demand for this model is relatively stable though there is enough variation to challenge management at Namata. Sometimes demand is lower than forecast, so that inventory costs are high. Other times the forecasts are too low. When this happens, on-hand inventory is not sufficient to meet customer demand and Namata requires expedited shipments to keep customers happy. This nearly wipes out Namata's profit margin on the expedited units. Profits at Namata would almost certainly increase if demand could be forecast more accurately.
In the Excel file:
a) Create a 3-week moving average forecast for week 71. Label your answer in the file.
b) Calculate the 3-week moving average forecast for all possible weeks.
c) Calculate the MAD for all possible weeks. Formulas is provided below. Label your answer in the file.
d) Create a SINGLE graph of the actual demand and the 3-week moving average forecast.
e) Save and submit this file. We will be grading the work and answers in the Excel file.


Homework Answers
a)
3-week Moving Average Forecast for Week 71 = (Sales in Week 68 + Sales in Week 69 + Sales in Week 70) / 3
= ( 484 + 467 + 500) / 3
= 1451 / 3
= 483.67
b)
3-week Moving Average Forecast for Week (n + 3) = ( Sales in Week n + Sales in Week (n + 1) + Sales in Week (n+2)) /3
Therefore, the 3-week Moving Average Forecast Values are calculated as per below table:
| Week | Sales1 | 3 Week Moving Average Forecast |
| 1 | 459 | |
| 2 | 494 | |
| 3 | 429 | |
| 4 | 470 | 460.67 |
| 5 | 460 | 464.33 |
| 6 | 458 | 453.00 |
| 7 | 480 | 462.67 |
| 8 | 469 | 466.00 |
| 9 | 478 | 469.00 |
| 10 | 460 | 475.67 |
| 11 | 480 | 469.00 |
| 12 | 437 | 472.67 |
| 13 | 442 | 459.00 |
| 14 | 449 | 453.00 |
| 15 | 444 | 442.67 |
| 16 | 437 | 445.00 |
| 17 | 456 | 443.33 |
| 18 | 457 | 445.67 |
| 19 | 434 | 450.00 |
| 20 | 457 | 449.00 |
| 21 | 407 | 449.33 |
| 22 | 396 | 432.67 |
| 23 | 376 | 420.00 |
| 24 | 367 | 393.00 |
| 25 | 367 | 379.67 |
| 26 | 372 | 370.00 |
| 27 | 336 | 368.67 |
| 28 | 327 | 358.33 |
| 29 | 333 | 345.00 |
| 30 | 359 | 332.00 |
| 31 | 357 | 339.67 |
| 32 | 399 | 349.67 |
| 33 | 383 | 371.67 |
| 34 | 417 | 379.67 |
| 35 | 448 | 399.67 |
| 36 | 429 | 416.00 |
| 37 | 443 | 431.33 |
| 38 | 431 | 440.00 |
| 39 | 468 | 434.33 |
| 40 | 481 | 447.33 |
| 41 | 484 | 460.00 |
| 42 | 498 | 477.67 |
| 43 | 526 | 487.67 |
| 44 | 517 | 502.67 |
| 45 | 504 | 513.67 |
| 46 | 503 | 515.67 |
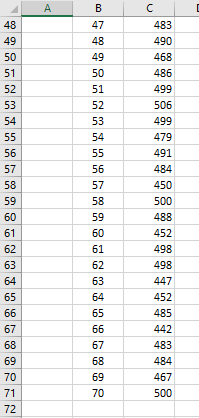
| 47 | 483 | 508.00 |
| 48 | 490 | 496.67 |
| 49 | 468 | 492.00 |
| 50 | 486 | 480.33 |
| 51 | 499 | 481.33 |
| 52 | 506 | 484.33 |
| 53 | 499 | 497.00 |
| 54 | 479 | 501.33 |
| 55 | 491 | 494.67 |
| 56 | 484 | 489.67 |
| 57 | 450 | 484.67 |
| 58 | 500 | 475.00 |
| 59 | 488 | 478.00 |
| 60 | 452 | 479.33 |
| 61 | 498 | 480.00 |
| 62 | 498 | 479.33 |
| 63 | 447 | 482.67 |
| 64 | 452 | 481.00 |
| 65 | 485 | 465.67 |
| 66 | 442 | 461.33 |
| 67 | 483 | 459.67 |
| 68 | 484 | 470.00 |
| 69 | 467 | 469.67 |
| 70 | 500 | 478.00 |
| 71 | 483.67 |
c)
MAD (Mean Absolute Deviation) calculation is as follows:
For each month, Error value has to be calculated.
Error = Sales - Forecast
Then, the Absolute Value of Error is calculated, ie the negative values of error shall be turned into positive values.
MAD = Mean value of Absolute Values of Error
MAD is calculated as per below table:
| Week | Sales1 | 3 Week Moving Average Forecast | Error | Absolute Value of Error |
| 1 | 459 | |||
| 2 | 494 | |||
| 3 | 429 | |||
| 4 | 470 | 460.67 | 9.33 | 9.33 |
| 5 | 460 | 464.33 | -4.33 | 4.33 |
| 6 | 458 | 453.00 | 5.00 | 5.00 |
| 7 | 480 | 462.67 | 17.33 | 17.33 |
| 8 | 469 | 466.00 | 3.00 | 3.00 |
| 9 | 478 | 469.00 | 9.00 | 9.00 |
| 10 | 460 | 475.67 | -15.67 | 15.67 |
| 11 | 480 | 469.00 | 11.00 | 11.00 |
| 12 | 437 | 472.67 | -35.67 | 35.67 |
| 13 | 442 | 459.00 | -17.00 | 17.00 |
| 14 | 449 | 453.00 | -4.00 | 4.00 |
| 15 | 444 | 442.67 | 1.33 | 1.33 |
| 16 | 437 | 445.00 | -8.00 | 8.00 |
| 17 | 456 | 443.33 | 12.67 | 12.67 |
| 18 | 457 | 445.67 | 11.33 | 11.33 |
| 19 | 434 | 450.00 | -16.00 | 16.00 |
| 20 | 457 | 449.00 | 8.00 | 8.00 |
| 21 | 407 | 449.33 | -42.33 | 42.33 |
| 22 | 396 | 432.67 | -36.67 | 36.67 |
| 23 | 376 | 420.00 | -44.00 | 44.00 |
| 24 | 367 | 393.00 | -26.00 | 26.00 |
| 25 | 367 | 379.67 | -12.67 | 12.67 |
| 26 | 372 | 370.00 | 2.00 | 2.00 |
| 27 | 336 | 368.67 | -32.67 | 32.67 |
| 28 | 327 | 358.33 | -31.33 | 31.33 |
| 29 | 333 | 345.00 | -12.00 | 12.00 |
| 30 | 359 | 332.00 | 27.00 | 27.00 |
| 31 | 357 | 339.67 | 17.33 | 17.33 |
| 32 | 399 | 349.67 | 49.33 | 49.33 |
| 33 | 383 | 371.67 | 11.33 | 11.33 |
| 34 | 417 | 379.67 | 37.33 | 37.33 |
| 35 | 448 | 399.67 | 48.33 | 48.33 |
| 36 | 429 | 416.00 | 13.00 | 13.00 |
| 37 | 443 | 431.33 | 11.67 | 11.67 |
| 38 | 431 | 440.00 | -9.00 | 9.00 |
| 39 | 468 | 434.33 | 33.67 | 33.67 |
| 40 | 481 | 447.33 | 33.67 | 33.67 |
| 41 | 484 | 460.00 | 24.00 | 24.00 |
| 42 | 498 | 477.67 | 20.33 | 20.33 |
| 43 | 526 | 487.67 | 38.33 | 38.33 |
| 44 | 517 | 502.67 | 14.33 | 14.33 |
| 45 | 504 | 513.67 | -9.67 | 9.67 |
| 46 | 503 | 515.67 | -12.67 | 12.67 |
| 47 | 483 | 508.00 | -25.00 | 25.00 |
| 48 | 490 | 496.67 | -6.67 | 6.67 |
| 49 | 468 | 492.00 | -24.00 | 24.00 |
| 50 | 486 | 480.33 | 5.67 | 5.67 |
| 51 | 499 | 481.33 | 17.67 | 17.67 |
| 52 | 506 | 484.33 | 21.67 | 21.67 |
| 53 | 499 | 497.00 | 2.00 | 2.00 |
| 54 | 479 | 501.33 | -22.33 | 22.33 |
| 55 | 491 | 494.67 | -3.67 | 3.67 |
| 56 | 484 | 489.67 | -5.67 | 5.67 |
| 57 | 450 | 484.67 | -34.67 | 34.67 |
| 58 | 500 | 475.00 | 25.00 | 25.00 |
| 59 | 488 | 478.00 | 10.00 | 10.00 |
| 60 | 452 | 479.33 | -27.33 | 27.33 |
|
Know the answer?
Add Answer to:
|
 ase 2 A firm has been started by a diary famer to produce and retail ice cream directly to the public. All its ice cream is sold through its own retail outlet, situated next to its farm, as it does not want other retailers to make profits from its products, and wants to ensure strict quality control all the way through from production to sales to the end customer. It can make reasonable predictions of the demand it faces up...
 Problem 12-18 Net Present Value Analysis (L012-2] Oakmont Company has an opportunity to manufacture and sell a new product for a four-year period. The company's discount rate it 16%. After careful study, Oakmont estimated the following costs and revenues for the new product: Cost of equipment needed Working capital needed Overhaul of the equipment in year two Salvage value of the equipment in four years $ 170,000 $ 68,000 $ 12,000 $ 16,000 Annual revenues and costs Sales revenues Variable...