
Homework Answers
28)
a.

estimated slope =500 and intercept = -500
b.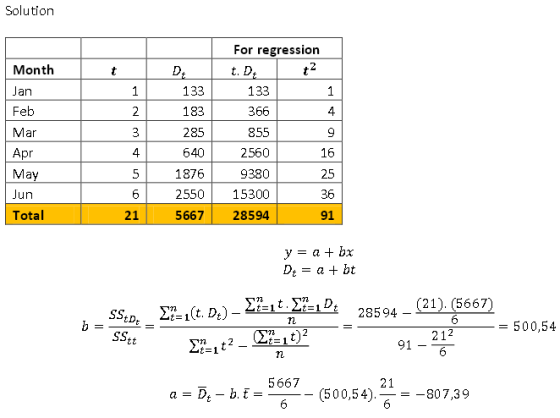

Therefore , Y = 500.54.X – 807.4
Slope = 500.54
Intercept = -807.4
c. 247= july, 248=August, 249=September and so on.
Forecast for July = -807.4 + (500.54 X 7) = 2696.38
|
Predicted values for: Number of patrons |
||||||
|
95% Confidence Intervals |
95% Prediction Intervals |
|||||
|
Month |
Predicted |
lower |
upper |
lower |
upper |
Leverage |
|
247 |
122,826.686 |
49,345.830 |
196,307.541 |
49,334.988 |
196,318.384 |
3388.295 |
|
248 |
123,327.229 |
49,544.619 |
197,109.839 |
49,533.820 |
197,120.637 |
3416.181 |
|
249 |
123,827.771 |
49,743.407 |
197,912.136 |
49,732.653 |
197,922.890 |
3444.181 |
|
250 |
124,328.314 |
49,942.195 |
198,714.434 |
49,931.484 |
198,725.144 |
3472.295 |
|
251 |
124,828.857 |
50,140.983 |
199,516.731 |
50,130.316 |
199,527.399 |
3500.524 |
|
252 |
125,329.400 |
50,339.771 |
200,319.029 |
50,329.147 |
200,329.653 |
3528.867 |
d.We are not much confident about this prediction because this year 2013 is 20 year from the data given.
Add Answer to:
8. Shoreline Park in Mountain View, California, has kept close tabs on the number of patrons...
28. Shoreline Park in Mountain View, California, has kept close tabs on the number of patrons...
 28. Shoreline Park in Mountain View, California, has kept close tabs on the number of patrons using the park since its opening in January 1993. For the first six months of 2013, the following figures were recorded Month Number of Patrons Month Number of Patrons January February March 133 183 285 April May June 640 1,876 2,550 i. Draw a graph of these six data points. Assume that January- period 1, February- period 2, and so on. Using a ruler,...
Shoreline Park in Mountain View has kept close tabs on the number of visitors using the park sinc...
 Shoreline Park in Mountain View has kept close tabs on the number of visitors using the park since its opening in January 2017. For the first six months of operations, the following data were recorded: 3. Month Number of Visitors 133 January February March April ay June 183 285 640 1876 2550 a. Determine the forecast for the next month (July) using exponential smoothing with trend. Assume a and B are equal to 0.1 and 0.3 respectively.
Shoreline Park in...
Shoreline Park in Mountain View has kept close tabs on the number of visitors using the park since its opening in January 2017. For the first six months of operations, the following data were recorded: 3. Month Number of Visitors 133 January February March April ay June 183 285 640 1876 2550 a. Determine the forecast for the next month (July) using exponential smoothing with trend. Assume a and B are equal to 0.1 and 0.3 respectively.
Shoreline Park in...
A hospital is analyzing its overhead costs. It is not clear whether the number of patient...
A hospital is analyzing its overhead costs. It is not clear whether the number of patient days or nursing hours would be the best cost driver to use in predicting the hospital’s overhead. The latest information on the hospital is as follows: Month Hospital Nursing No. of Overhead Overhead Cost Overhead Hours Patient Cost Per Per Patient Costs Days Nursing Hr. Day July $950,000 50,000 7,900 $19.00 $120.25 August $1,070,000 52,000 8,900 $20.58 $120.22...
Tempe Office Services and Supplies (TOSS) provides various products and services in the Tempe Research Park,...
 Tempe Office Services and Supplies (TOSS) provides various products and services in the Tempe Research Park, home to numerous high-tech and bio-tech companies. Making color copies is one of its most popular and profitable services. The controller performed a regression analysis of data from the Color Copy Department with the following results: 561.22689 0.966478 Intercept R square Number of observations x coefficient 0.05852 The regression output was based on the following data: Number of Color Month Copies July 24,350 August...
Tempe Office Services and Supplies (TOSS) provides various products and services in the Tempe Research Park,...
 Tempe Office Services and Supplies (TOSS) provides various products and services in the Tempe Research Park, home to numerous high-tech and bio-tech companies. Making color copies is one of its most popular and profitable services. The controller performed a regression analysis of data from the Color Copy Department with the following results: 561.22689 0.966478 Intercept R square Number of observations X coefficient 0.05852 The regression output was based on the following data: Month July August September October November December Number...
Thus, r_ (.9014) .8125, meaning that about 81% of the variability in sales can be explained...
 Thus, r_ (.9014) .8125, meaning that about 81% of the variability in sales can be explained by the regression model with advertising as the independent varia ble. Problems Nde ΡΧ mere te problem may be sch od with POM for Wrndows ardor Exco. 4.1 The following gives the number of pints of type B t wook of October 12 b) Use a 3-week weighted moving average, with weights of. 1, 3, and 6, using .6 for the most recent week....
Question 1: Wendy's Happy Homes Inc manufactures Home Appliances. Monthly sales of Wendy's Washer...
 this is a really long assignment and I need help
Question 1: Wendy's Happy Homes Inc manufactures Home Appliances. Monthly sales of Wendy's Washers and Dryer Sets for a nine month period were as follows: MONTH Washer and Dryer Sales 490 480 450 500 480 470 490 520 530 January February March April May June July August September Forecast October sales using 1) A four-month moving average 2) a six-month moving average 3. Compute the MAD for each forecast method...
this is a really long assignment and I need help
Question 1: Wendy's Happy Homes Inc manufactures Home Appliances. Monthly sales of Wendy's Washers and Dryer Sets for a nine month period were as follows: MONTH Washer and Dryer Sales 490 480 450 500 480 470 490 520 530 January February March April May June July August September Forecast October sales using 1) A four-month moving average 2) a six-month moving average 3. Compute the MAD for each forecast method...
Examples 1,2,3 1. Beyond Tea Inc. wants to forecast sales of its menthol green tea. The...
 Examples 1,2,3
1. Beyond Tea Inc. wants to forecast sales of its menthol green
tea. The company is considering either using a simple mean or a
three-period moving average to forecast monthly sales. Given sales
data for the past 10 months use both forecasting methods to
forecast periods 7 to 10 and then evaluate each. Which method
should they use? Use the selected method to make a forecast for
month 11. (Show all calculations .... Please read Examples1, 2, 3...
Examples 1,2,3
1. Beyond Tea Inc. wants to forecast sales of its menthol green
tea. The company is considering either using a simple mean or a
three-period moving average to forecast monthly sales. Given sales
data for the past 10 months use both forecasting methods to
forecast periods 7 to 10 and then evaluate each. Which method
should they use? Use the selected method to make a forecast for
month 11. (Show all calculations .... Please read Examples1, 2, 3...
Question 1: Wendy's Happy Homes Inc manufactures Home Appliances. Monthly sales of Wendy's Washer...
 Question 1: Wendy's Happy Homes Inc manufactures Home Appliances. Monthly sales of Wendy's Washers and Dryer Sets for a nine month period were as follows: MONTH Washer and Dryer Sales 490 480 450 500 480 470 490 520 530 January February March April May June July August September Forecast October sales using 1) A four-month moving average 2) a six-month moving average 3. Compute the MAD for each forecast method you used Actual October sales were 320 nits. 4) Which...
 28. Shoreline Park in Mountain View, California, has kept close tabs on the number of patrons using the park since its opening in January 1993. For the first six months of 2013, the following figures were recorded Month Number of Patrons Month Number of Patrons January February March 133 183 285 April May June 640 1,876 2,550 i. Draw a graph of these six data points. Assume that January- period 1, February- period 2, and so on. Using a ruler,...
 Shoreline Park in Mountain View has kept close tabs on the number of visitors using the park since its opening in January 2017. For the first six months of operations, the following data were recorded: 3. Month Number of Visitors 133 January February March April ay June 183 285 640 1876 2550 a. Determine the forecast for the next month (July) using exponential smoothing with trend. Assume a and B are equal to 0.1 and 0.3 respectively.
Shoreline Park in...
Shoreline Park in Mountain View has kept close tabs on the number of visitors using the park since its opening in January 2017. For the first six months of operations, the following data were recorded: 3. Month Number of Visitors 133 January February March April ay June 183 285 640 1876 2550 a. Determine the forecast for the next month (July) using exponential smoothing with trend. Assume a and B are equal to 0.1 and 0.3 respectively.
Shoreline Park in...
 Tempe Office Services and Supplies (TOSS) provides various products and services in the Tempe Research Park, home to numerous high-tech and bio-tech companies. Making color copies is one of its most popular and profitable services. The controller performed a regression analysis of data from the Color Copy Department with the following results: 561.22689 0.966478 Intercept R square Number of observations x coefficient 0.05852 The regression output was based on the following data: Number of Color Month Copies July 24,350 August...
 Tempe Office Services and Supplies (TOSS) provides various products and services in the Tempe Research Park, home to numerous high-tech and bio-tech companies. Making color copies is one of its most popular and profitable services. The controller performed a regression analysis of data from the Color Copy Department with the following results: 561.22689 0.966478 Intercept R square Number of observations X coefficient 0.05852 The regression output was based on the following data: Month July August September October November December Number...
 Thus, r_ (.9014) .8125, meaning that about 81% of the variability in sales can be explained by the regression model with advertising as the independent varia ble. Problems Nde ΡΧ mere te problem may be sch od with POM for Wrndows ardor Exco. 4.1 The following gives the number of pints of type B t wook of October 12 b) Use a 3-week weighted moving average, with weights of. 1, 3, and 6, using .6 for the most recent week....
 this is a really long assignment and I need help
Question 1: Wendy's Happy Homes Inc manufactures Home Appliances. Monthly sales of Wendy's Washers and Dryer Sets for a nine month period were as follows: MONTH Washer and Dryer Sales 490 480 450 500 480 470 490 520 530 January February March April May June July August September Forecast October sales using 1) A four-month moving average 2) a six-month moving average 3. Compute the MAD for each forecast method...
this is a really long assignment and I need help
Question 1: Wendy's Happy Homes Inc manufactures Home Appliances. Monthly sales of Wendy's Washers and Dryer Sets for a nine month period were as follows: MONTH Washer and Dryer Sales 490 480 450 500 480 470 490 520 530 January February March April May June July August September Forecast October sales using 1) A four-month moving average 2) a six-month moving average 3. Compute the MAD for each forecast method...
 Examples 1,2,3
1. Beyond Tea Inc. wants to forecast sales of its menthol green
tea. The company is considering either using a simple mean or a
three-period moving average to forecast monthly sales. Given sales
data for the past 10 months use both forecasting methods to
forecast periods 7 to 10 and then evaluate each. Which method
should they use? Use the selected method to make a forecast for
month 11. (Show all calculations .... Please read Examples1, 2, 3...
Examples 1,2,3
1. Beyond Tea Inc. wants to forecast sales of its menthol green
tea. The company is considering either using a simple mean or a
three-period moving average to forecast monthly sales. Given sales
data for the past 10 months use both forecasting methods to
forecast periods 7 to 10 and then evaluate each. Which method
should they use? Use the selected method to make a forecast for
month 11. (Show all calculations .... Please read Examples1, 2, 3...
 Question 1: Wendy's Happy Homes Inc manufactures Home Appliances. Monthly sales of Wendy's Washers and Dryer Sets for a nine month period were as follows: MONTH Washer and Dryer Sales 490 480 450 500 480 470 490 520 530 January February March April May June July August September Forecast October sales using 1) A four-month moving average 2) a six-month moving average 3. Compute the MAD for each forecast method you used Actual October sales were 320 nits. 4) Which...
Most questions answered within 3 hours.
-
Calculate the pH of each of the following solutions.
0.50 M HBr
3.1×10⁻⁴ M KOH
4.2×10⁻⁵...
asked 56 minutes ago -
For the year ended December 31, Depot Max’s cost of merchandise
sold was $85,600. Inventory at the...
asked 56 minutes ago -
Week 10 - Professional Memo Assignment
Professional Memo Assignment
Your mission for this week, should you...
asked 1 hour ago -
Write a Python program that stores the data for each
player on the team, and it...
asked 1 hour ago -
In
the last 3 months, mike never knows when he is going to get his
allowance...
asked 1 hour ago -
Is Ca(OH)2 a Bronsted base, Lewis base, or both? Why?
asked 1 hour ago -
1A- Why don’t voters complain about U.S. tariffs on imported
sugar?
Because sugar is only a...
asked 1 hour ago -
Cash Payback Period
Primera Banco is evaluating two capital investment proposals for
a drive-up ATM kiosk,...
asked 1 hour ago -
Create a button in Swift (Xcode) that will create a charge,
create a charge using Stripe's...
asked 1 hour ago -
The reaction rate of CO and NO2 in the reaction
CO(g) + NO2(g) → CO2(g) +...
asked 1 hour ago -
Imagine that a chemist puts 6.40 mol each of
C3H8 and O2 in a 1.00-L container...
asked 1 hour ago -
How much money should be invested today in order to have $8340
at the end of...
asked 1 hour ago