


this is a really long assignment and I need help
5) Forecast November and December using the method you believe to be the most accurate. Question 2 (Copy the file to Excel when done submit here) Refer to the gasoline sales time series data in Tablé below to answer the following 1. Compute Three- week, four-week and five-week moving averages for the time 2. Compute the MSE for Three- week, the four-week and five-week moving average 3. Create a new column to show the trend line (y- mxtb) for the table below series forecasts. (Look over the PowerPoint) 4. What appears to be the best number of weeks of past data (three, four. or five) to 5. Plot gasoline sales time series after obtaining the contract with the Vermont state 6. Plot gasoline sales time series and three-week moving average Forecasts use in the moving average computation? police 7. Plot gasoline sales time series and add the trend line to graph 211 words Type here to search
Paragraph Styles Font GASOLINE SALES TIME SERIES AFTER OBTAINING THE CONTRACT WITH THE VERMOFI STATE POLICE Week Sale (1000s of Gallons) 13 19 31 34 15
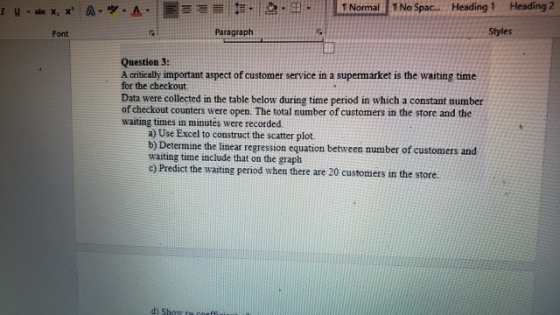
2,田. Heading 2 Styles Heading 1 r u ,嵌x, x. A·ツ. A. | -5- 1 Normal 1 No Spac Paragraph Font Question 3: A critically important aspect of customer service in a supermarket is the waiting time for the checkout Data were collected in the table below during time period in which a constant number of checkout counters were open. The total number of customers in the store and the waiting times in minutes were recorded a) Use Excel to construct the scatter plot. b) Determine the linear regression equation between number of customers and waiting time include that on the graph c) Predict the waiting period when there are 20 customers in the store.
Noma T Normal 11 No Spac ←· 2-田. r u . aa x, x' A. y. A. Heading! Heading 2 . Paragraph Styles Font 12 35 25 13 2.3 0.2 0.7 2.5 15 16 17 18 19 20 21 16 21 17 3.8 16 2.8 14 15 21 27 17 1.7 23 24 25 2.9 2831 34 29 30 4.8
Paragraph members. Number of incorrect Day ills 10
1 Normal Paragraph 10 12 13 14 1e 17 18 19 20 23 24 26 27 28 29 Everyone looked at the data that had been presented Then im essla
25 26 27 28 29 30 Everyone looked at the data that had been presented. Then Tim exclaimed: "Notice that the number of errors increases in the last third of the month. The computer system had been in place for the entire month so that can't be the problem Scott, it is probably the new employees you have on staff that are not entering the data properly Scott quickly retaliated: The employees are trained properly! Everyone knows the problem is the computer system! The argument between Tim and Scott become heated, and Larraine decided to step in. She said".Scott. I think it is best if you perform some statistical analysis of that data and send us your findings. You know that we want a high-quality standard We can't be Motorola with six-sigma quantity, but let's try for three-sigma. Would you develop some control charts with the data and let us know if you think the process is in control?" Case Questions 1. Setup three-sipma control limits with the given data and graph it usng Excel (Go to the link for help ihttps-//www.youtabe.com./watch?y osl7KYzAndo Make sure the mean, upper control and lower control Sigma on the graph 2. Is the process in control? Why? 3. Based on your analysis do you think the problem is the new computer system or something else? 4. What advice would you give to Larraine based on the information that you have? re to search
Homework Answers


Add Answer to:
Question 1: Wendy's Happy Homes Inc manufactures Home Appliances. Monthly sales of Wendy's Washer...
Question 1: Wendy's Happy Homes Inc manufactures Home Appliances. Monthly sales of Wendy's Washer...
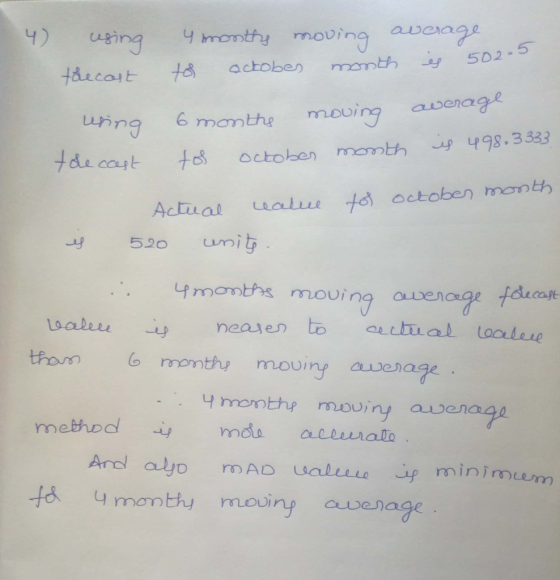
 Question 1: Wendy's Happy Homes Inc manufactures Home Appliances. Monthly sales of Wendy's Washers and Dryer Sets for a nine month period were as follows: MONTH Washer and Dryer Sales 490 480 450 500 480 470 490 520 530 January February March April May June July August September Forecast October sales using 1) A four-month moving average 2) a six-month moving average 3. Compute the MAD for each forecast method you used Actual October sales were 320 nits. 4) Which...
Consider the following gasoline sales time series data. Click onthe datafile logo to reference th...
 Consider the following gasoline sales time series data. Click onthe datafile logo to reference the data. Week Sales (1000s of gallons) 17 21 17 15 20 18 21 21 16 21 6 10 12 a. Using a weight of for the most recent observation, for the second most recent observation, and the time series (to 2 decimals). Enter negative values as negative numbers. third the most recent observation, compute a three-week weighted moving average for Forecast Weighted Moving Average Forecast...
Consider the following gasoline sales time series data. Click on the datafile logo to reference the...
Consider the following gasoline sales time series data. Click on the datafile logo to reference the data. Week Sales (1000s of gallons) 1 17 2 20 3 19 4 23 5 18 6 16 7 19 8 18 9 23 10 19 11 15 12 22 a. Using a weight of for the most recent observation, for the second most recent observation, and third the most recent observation, compute a three-week...
Problem 15-07 (Algorithmic) Refer to the gasoline sales time series data in the given table. 1...
 Problem 15-07 (Algorithmic) Refer to the gasoline sales time series data in the given table. 1 Week Sales (1000s of gallons) 17 2 20 21 11 14 22 a. Compute four-week and five-week moving averages for the time series. Round your answers to two decimal places. 4-Week 5-Week Moving Average Moving Average Week Sales 17 9 10 11 12 17 DE 23 21 C C 14 22 b. Compute the MSE for the four-week and five-week moving average forecasts. Round...
Consider the following gasoline sales time series data. Click on the datafile logo to reference the...
 Consider the following gasoline sales time series data. Click on the datafile logo to reference the data 00s Week of gallons) 18 21 18 24 18 17 1S 17 21 10 11 16 21 12 a. Using a welight of for the most recent observation, for the second most recent observation, andthird the most recent observation, compute a three-week weighted moving averape for the time serles (to 2 declmals). Enter negative values as negative numbers. Weighted Moving Forecast (Error)2 Time-Series...
The monthly sales for Telco Batteries Inc. were as follows:
Problem # 1The monthly sales for Telco Batteries Inc. were as follows: SalesMonth (000 units)January 20February 21March 15April 14May 13June 16July 17August 18September 20October 20November 21December 23Plot the monthly sales data.Forecast coming January sales using each of the following:The naïve approachA 6-month moving averageA 6-month weighted average using 0.1, 0.1, 0.1, 0.2, 0.2 and 0.3, with the heaviest weights applied to the most recent months.Calculate the mean absolute deviation (MAD) and the mean squared error (MSE) for each of...
Forecasts and actual sales of MP3 players at Just Say Musicare as follows: Month Forecast Actual Sales March &nb
Forecasts and actual sales of MP3 players at Just Say Musicare as follows: Month Forecast Actual Sales March 150 170 April 220 229 May 205 192 June 256 241 July 250 238 August 260 210 September 270 225 October 280 179 a. Plot the data and show the plot using Excel, Word or PowerPoint. b. Provide insights about the time series c. What is the forecast for November, using a two-period moving average? Note also that the forecast values provided are irrelevant to computing these moving average forecasts. d. What is the forecast for November, using a three-period...
1. National Scan, Inc sells radio frequency inventory tags. Monthly sales for a seven-month period were as follows:
1. National Scan, Inc sells radio frequency inventory tags. Monthly sales for a seven-month period were as follows: Month Sales (000 units) Feb. 21 Mar. 20 Apr. 17 May 22 Jun. 20 Aug. 22 a. Plot the monthly data on a sheet of graph paper.b. Forecast September sales volume using each of the following: (1) The naive approach (2) A five month moving average (3) A weighted average using 60 for August, 30 for July, and. 10 for June (4) Exponential smoothing with a smoothing constant equal to.20, assuming a March-forecast of...
2. National Scan, Inc., sells radio frequency inventory tags. Monthly sales for a seven-month period were...
 2. National Scan, Inc., sells radio frequency inventory tags. Monthly sales for a seven-month period were as follows: Sales (000 units) Month Feb. 19 Mar. 18 15 Apr. May 20 Jun. 18 Jul. 22 Aug. 20 a. Plot the monthly data on a sheet of graph paper. b. Forecast September sales volume using each of the following: (1) The naive approach (2) A five month moving average 3. Compute the multifactor productivity measure for each of the weeks shown for...
I just need help with those marked with a red X, and the last question thank...
 I just need help with those marked with a
red X, and the last question thank you!
Problem 15-08 (Algorithmic) Refer again to the gasoline sales time series data in the following table. Week Sales (1000s of gallons) a. Using a weight of 1/2 for the most recent observation, 1/3 for the second most recent, and 1/6 for third most recent, compute a three-week weighted moving average for the time series. Use rounded for two decimal places values for intermediate...
I just need help with those marked with a
red X, and the last question thank you!
Problem 15-08 (Algorithmic) Refer again to the gasoline sales time series data in the following table. Week Sales (1000s of gallons) a. Using a weight of 1/2 for the most recent observation, 1/3 for the second most recent, and 1/6 for third most recent, compute a three-week weighted moving average for the time series. Use rounded for two decimal places values for intermediate...
 Question 1: Wendy's Happy Homes Inc manufactures Home Appliances. Monthly sales of Wendy's Washers and Dryer Sets for a nine month period were as follows: MONTH Washer and Dryer Sales 490 480 450 500 480 470 490 520 530 January February March April May June July August September Forecast October sales using 1) A four-month moving average 2) a six-month moving average 3. Compute the MAD for each forecast method you used Actual October sales were 320 nits. 4) Which...
 Consider the following gasoline sales time series data. Click onthe datafile logo to reference the data. Week Sales (1000s of gallons) 17 21 17 15 20 18 21 21 16 21 6 10 12 a. Using a weight of for the most recent observation, for the second most recent observation, and the time series (to 2 decimals). Enter negative values as negative numbers. third the most recent observation, compute a three-week weighted moving average for Forecast Weighted Moving Average Forecast...
 Problem 15-07 (Algorithmic) Refer to the gasoline sales time series data in the given table. 1 Week Sales (1000s of gallons) 17 2 20 21 11 14 22 a. Compute four-week and five-week moving averages for the time series. Round your answers to two decimal places. 4-Week 5-Week Moving Average Moving Average Week Sales 17 9 10 11 12 17 DE 23 21 C C 14 22 b. Compute the MSE for the four-week and five-week moving average forecasts. Round...
 Consider the following gasoline sales time series data. Click on the datafile logo to reference the data 00s Week of gallons) 18 21 18 24 18 17 1S 17 21 10 11 16 21 12 a. Using a welight of for the most recent observation, for the second most recent observation, andthird the most recent observation, compute a three-week weighted moving averape for the time serles (to 2 declmals). Enter negative values as negative numbers. Weighted Moving Forecast (Error)2 Time-Series...
 2. National Scan, Inc., sells radio frequency inventory tags. Monthly sales for a seven-month period were as follows: Sales (000 units) Month Feb. 19 Mar. 18 15 Apr. May 20 Jun. 18 Jul. 22 Aug. 20 a. Plot the monthly data on a sheet of graph paper. b. Forecast September sales volume using each of the following: (1) The naive approach (2) A five month moving average 3. Compute the multifactor productivity measure for each of the weeks shown for...
 I just need help with those marked with a
red X, and the last question thank you!
Problem 15-08 (Algorithmic) Refer again to the gasoline sales time series data in the following table. Week Sales (1000s of gallons) a. Using a weight of 1/2 for the most recent observation, 1/3 for the second most recent, and 1/6 for third most recent, compute a three-week weighted moving average for the time series. Use rounded for two decimal places values for intermediate...
I just need help with those marked with a
red X, and the last question thank you!
Problem 15-08 (Algorithmic) Refer again to the gasoline sales time series data in the following table. Week Sales (1000s of gallons) a. Using a weight of 1/2 for the most recent observation, 1/3 for the second most recent, and 1/6 for third most recent, compute a three-week weighted moving average for the time series. Use rounded for two decimal places values for intermediate...
Most questions answered within 3 hours.
-
If you’re standing at the bottom of a hill and asked to evaluate
it while being...
asked 1 minute ago -
A 8.15- g bullet from a 9-mm pistol has a velocity of 366.0 m/s.
It strikes...
asked 1 hour ago -
The outstanding bonds of Alpha Extracts have a yield to maturity
of 7.4 percent and a...
asked 1 hour ago -
The Problem: The Case of the Harmonizing Vacations
Your CEO is exploring partnering with a European...
asked 2 hours ago -
A chemical equation is balanced by adding coefficients in front
of some formulas so that the...
asked 2 hours ago -
From the literature (reference your sources): What are the
lattice parameters of calcite and aragonite? Why...
asked 3 hours ago -
Your system is rejecting the question am asking which is
preceded by a case study. It...
asked 3 hours ago -
3. On January 2, 2000, Larry creates a trust with himself as
trustee. Larry as trustee...
asked 3 hours ago -
A member of the volleyball team spikes the ball. During this
process, she changes the velocity...
asked 3 hours ago -
Are adult gamers less likely to use a gaming console (Xbox,
PlayStation, Wii, etc...) than teen...
asked 4 hours ago -
The University of
Texas recently reported that 43% of college students aged 18-24
would spend their...
asked 4 hours ago -
The length of stay at a specific emergency department in
Phoenix, Arizona, in 2009 had a...
asked 3 hours ago