
Homework Answers
a) For n - 1 = 66 degrees of freedom, we get from the t
distribution tables that:
P( -1.668 < t66 < 1.668) = 0.9
Therefore the 90% confidence interval here is obtained as:

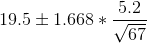


This is the required 90% confidence interval here.
b) From t distribution tables, we have here:
P( -1.997 < t66 < 1.997) = 0.95
Therefore the confidence interval here is obtained as:


This is the required 95% confidence interval here.
Add Answer to:
You may need to use the appropriate appendix table or technology to answer this question. Sales...
Sales personnel for Skillings Distributors submit weekly reports listing the customer contacts made during the week....
Sales personnel for Skillings Distributors submit weekly reports listing the customer contacts made during the week. A sample of 65 weekly reports showed a sample mean of 19.5 customer contacts per week. The sample standard deviation was 5.2. a)Develop a 90% confidence interval estimate of the population mean number of weekly customer contacts for the sales personnel. b)Develop a 95% confidence interval estimate of the population mean number of weekly customer contacts for the sales personnel. c)Discuss what happens to...
Sales personnel for Skillings Distributors submit weekly reports listing the customer contacts made during the week....
Sales personnel for Skillings Distributors submit weekly reports listing the customer contacts made during the week. A sample of 55 weekly reports showed a sample mean of 19.5 customer contacts per week. The sample standard deviation was 5.9. Provide 90% and 95% confidence intervals for the population mean number of weekly customer contacts for the sales personnel. 90% confidence interval, to 2 decimals: ( , ) 95% confidence interval, to 2 decimals: ( , )
A simple random sample of 90 items from a population with = 9 resulted in a...
A simple random sample of 90 items from a population with = 9 resulted in a sample mean of 38. If required, round your answers to two decimal places. a. Provide a 90% confidence interval for the population mean. to b. Provide a 95% confidence interval for the population mean. to c. Provide a 99% confidence interval for the population mean. to Sales personnel for Skillings Distributors submit weekly reports listing the customer contacts made during the week. A sample...
Sales personnel for Skillings Distributors submit weekly reports listing the customer contacts made during the week....
Sales personnel for Skillings Distributors submit weekly reports listing the customer contacts made during the week. A sample of 75 weekly reports showed a sample mean of 18.5 customer contacts per week. The sample standard deviation was 5.2. Provide 90% and 95% confidence intervals for the population mean number of weekly customer contacts for the sales personnel. a. 90% Confidence, to 2 decimals b. 95% Confidence, to 2 decimals
Sales personnel for Skillings Distributors submit weekly reports listing the customer contacts mace during the week....
 Sales personnel for Skillings Distributors submit weekly reports listing the customer contacts mace during the week. A sample of 75 weekly reports showed a sampie mean of 18.5 customer contacts per week. The sample standard deviation was s.6. Provde 90% and 95% confidence intervals for the population mean nunter of weekly astomer conta tsfor the sales personnel. 90% Cerfidence interval, to 2 decimals: 95% confidence interval, to 2 deomas: A simple random sample of 70 items from a population with...
Sales personnel for Skillings Distributors submit weekly reports listing the customer contacts made during the week....
 Sales personnel for Skillings Distributors submit weekly reports listing the customer contacts made during the week. A sample of 85 weekly reports showed a sample mean of 17.5 customer contacts per week. The sample standard deviation was 5.8. Provide 90% and 95% confidence intervals for the population mean number of weekly customer contacts for the sales personnel. 90% confidence interval, to 2 decimals: 113 95% confidence interval, to 2 decimals
Sales personnel for Skillings Distributors submit weekly reports listing the customer contacts made during the week....
Sales personnel for Skillings Distributors submit weekly reports listing the customer contacts made during the week. A sample of 55 weekly reports showed a sample mean of 17.5 customer contacts per week. The sample standard deviation was 5.5. Provide 90% and 95% confidence intervals for the population mean number of weekly customer contacts for the sales personnel. 90% Confidence interval, to 2 decimals: ( , ) 95% Confidence interval, to 2 decimals: ( , )
Check My Work eBook Video Sales personnel for Skillings Distributors submit weekly reports listing the customer...
 Check My Work eBook Video Sales personnel for Skillings Distributors submit weekly reports listing the customer contacts made during the week. A s ample of 75 weekly reports showed a sample mean of 17. customer contacts per week. The sample standard deviation was SS. Provide 90% and 95% condence sales personnel. intervals for the population mean number of weekly customer contacts for the 90% confidence interval, to 2 decimals: 95% confidence interval, to 2 decimals:
Sales personnel for Skillings Distributors submit weekly reports listing the customer contacts made during the week....
Sales personnel for Skillings Distributors submit weekly reports listing the customer contacts made during the week. A sample of 75 weekly reports showed a sample mean of 17.5 customer contacts per week. The sample standard deviation was 5.6 . Provide 90% and 95% confidence intervals for the population mean number of weekly customer contacts for the sales personnel.
Sales personnel for Skillings Distributors submit weekly reports listing the customer contacts made during the week....
Sales personnel for Skillings Distributors submit weekly reports listing the customer contacts made during the week. A sample of 75 weekly reports showed a sample mean of 18.5 customer contacts per week. The sample standard deviation was 5.1. Provide 90% and 95% confidence intervals for the population mean number of weekly customer contacts for the sales personnel. 90% Confidence, to 2 decimals: ( , ) 95% Confidence, to 2 decimals: ( , )
 Sales personnel for Skillings Distributors submit weekly reports listing the customer contacts mace during the week. A sample of 75 weekly reports showed a sampie mean of 18.5 customer contacts per week. The sample standard deviation was s.6. Provde 90% and 95% confidence intervals for the population mean nunter of weekly astomer conta tsfor the sales personnel. 90% Cerfidence interval, to 2 decimals: 95% confidence interval, to 2 deomas: A simple random sample of 70 items from a population with...
 Sales personnel for Skillings Distributors submit weekly reports listing the customer contacts made during the week. A sample of 85 weekly reports showed a sample mean of 17.5 customer contacts per week. The sample standard deviation was 5.8. Provide 90% and 95% confidence intervals for the population mean number of weekly customer contacts for the sales personnel. 90% confidence interval, to 2 decimals: 113 95% confidence interval, to 2 decimals
 Check My Work eBook Video Sales personnel for Skillings Distributors submit weekly reports listing the customer contacts made during the week. A s ample of 75 weekly reports showed a sample mean of 17. customer contacts per week. The sample standard deviation was SS. Provide 90% and 95% condence sales personnel. intervals for the population mean number of weekly customer contacts for the 90% confidence interval, to 2 decimals: 95% confidence interval, to 2 decimals:
Most questions answered within 3 hours.
-
The free energy change for the following reaction at 25 °C, when
[Sn2+] = 1.17 M...
asked 1 hour ago -
An MNE is this kind of industry when competition in one country
is essentially independent of...
asked 2 hours ago -
. For this set of questions, determine what
proportion of a normal distribution is located betweeneach...
asked 3 hours ago -
A college student is employed as a door-to-door newspaper
salesman. Historical data suggests that the student...
asked 4 hours ago -
MATLAB HW 11 problem using Switch Case and Input commands
Write a script file that calculates...
asked 4 hours ago -
Considering gravitational time dilation, calculate the time that
passes in Earth’s surface while 1 hour passes...
asked 4 hours ago -
Minitab Problem: Take the Lake Hume June rainfall data and find
use the processes outlined in...
asked 5 hours ago -
X Company is trying to decide whether to continue using old
equipment to make Product A...
asked 5 hours ago -
IN PYTHON ONLY !! Program 2: Re-work
program #5 (WeeklyHours) from the previous assignment such that...
asked 6 hours ago -
The average length of time between arrivals at a turnpike
toll-booth is 26 seconds. What is...
asked 7 hours ago -
(a) A piston at 6.1 atm contains a gas that occupies a volume of
3.5 L....
asked 9 hours ago -
Please answer true or false. Words
cannot be changed or added in to make it true...
asked 9 hours ago