The following table lists a portion of the data representing the annual returns (in percent) over...
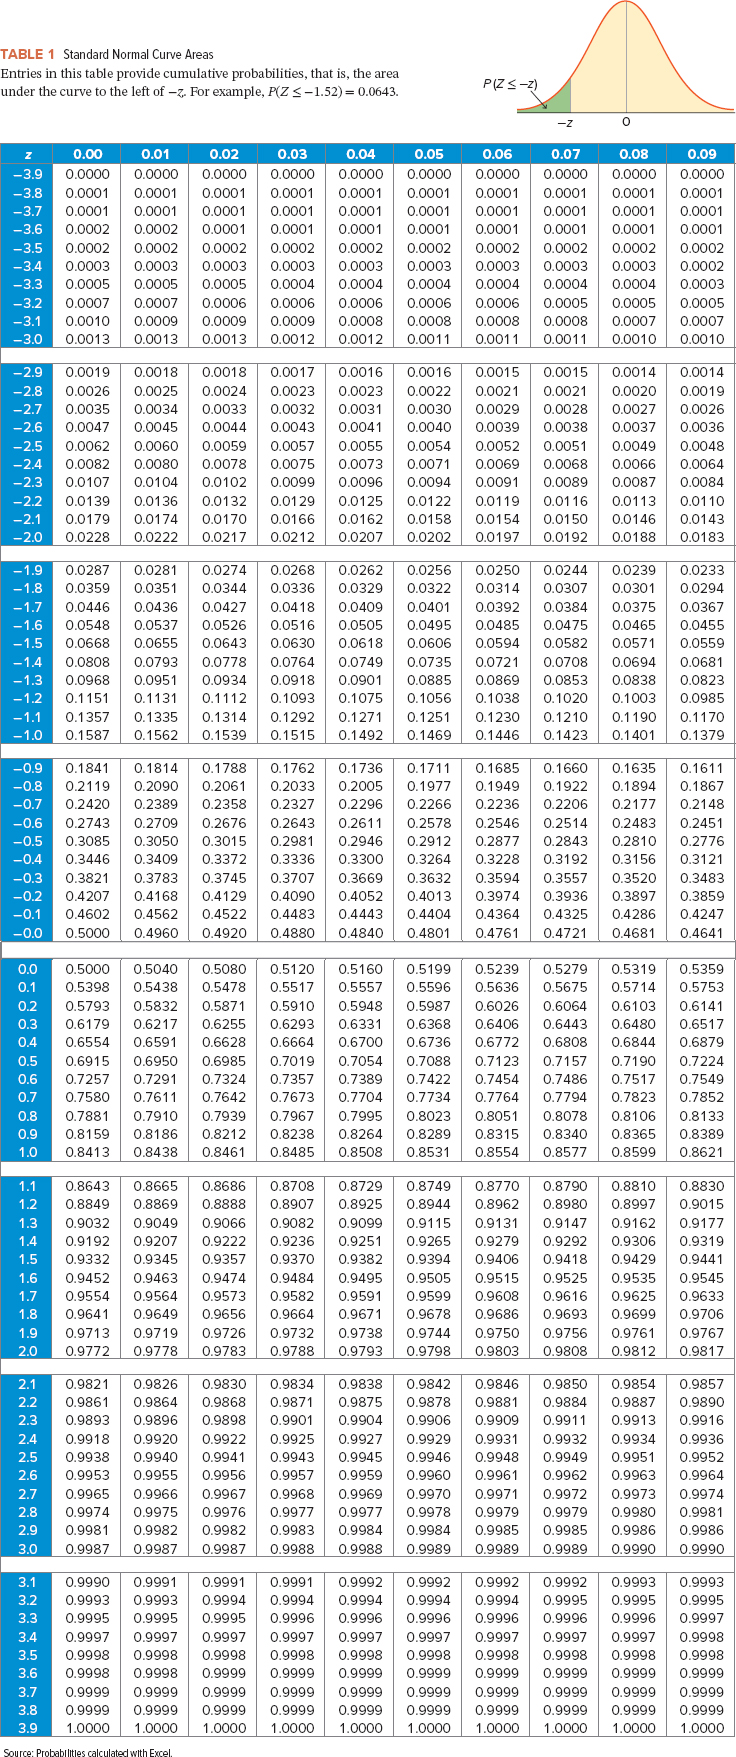
The following table lists a portion of the data representing the annual returns (in percent) over a 10-year period for the Balanced mutual fund, a top-performing mutual fund from the Janus Capital Group. (You may find it useful to reference the z table.).
*THE ANSWER IS NOT 0.72*
*THE ANSWER IS NOT 0.72*
*THE ANSWER IS NOT 0.72*
*THE ANSWER IS NOT 0.72*
*THE ANSWER IS NOT 0.72*
*THE ANSWER IS NOT 0.72*
| Year | Return |
| 2007 | 10.15 |
| 2008 | -15.22 |
| 2009 | 24.28 |
| 2010 | 7.83 |
| 2011 | 1.44 |
| 2012 | 13.07 |
| 2013 | 19.72 |
| 2014 | 8.46 |
| 2015 | 0.60 |
| 2016 | 4.51 |
Q: Calculate the value of the test statistic, assuming that the sampling distribution of T is normally distributed. (Round intermediate calculations to at least 4 decimal places and final answer to 2 decimal places.)
*NOTE: This has been answered wrong twice with a T value. I think that I need to give a Z value but I am not positive.
Homework Answers


Add Answer to:
The following table lists a portion of the data representing the
annual returns (in percent) over...
An investor owns a portfolio consisting of two mutual funds, A and B, with 60% invested in A. The following table lists...
 An investor owns a portfolio consisting of two mutual funds, A
and B, with 60% invested in A. The following table lists the inputs
for these funds.
An investor owns a portfolio consisting of two mutual funds, A and B, with 60% invested in A. The following table lists the inputs for these funds. Fund B Fund A 30 Measures Expected value Variance Covariance 24 49 87 36 a. Calculate the expected value for the portfolio return. (Round your answer...
An investor owns a portfolio consisting of two mutual funds, A
and B, with 60% invested in A. The following table lists the inputs
for these funds.
An investor owns a portfolio consisting of two mutual funds, A and B, with 60% invested in A. The following table lists the inputs for these funds. Fund B Fund A 30 Measures Expected value Variance Covariance 24 49 87 36 a. Calculate the expected value for the portfolio return. (Round your answer...
The following table lists a portion of the data derived from a matched-pairs sample. Use Table...
The following table lists a portion of the data derived from a matched-pairs sample. Use Table 1. Observation Sample 1 Sample 2 1 124 128 2 155 173 ⋮ ⋮ ⋮ 10 176 157 Assuming that T is normally distributed, determine the value of the test statistic. (Negative value should be indicated by a minus sign. Round intermediate calculations to at least 4 decimal places and final answer to 2 decimal places.) Test statistic:______________ Observation Sample 1 Sample 2 1...
Need in the next hour. The following table shows the annual retums for two of Vanguard's...
 Need in the next hour.
The following table shows the annual retums for two of Vanguard's mutual funds: the Vanguard Energy Fund and the Vanguard Healthcare Fund. Use Table 2 Annual Total Returns (in percent) Year 2004 2005 2006 2007 2008 Energy x 31.40 20.20 18.25 34.00 -34.15 Healthcare y 9.45 14.26 9.72 4.42 -17.42 x13.94 27.74 -4.09 Sy 12.52 Sxy 305.64 SOURCE: www.finance.yahoo.com. Calculate and interpret the sample correlation coefficient rxy (Round intermediate calculations to at least 4 decimal...
Need in the next hour.
The following table shows the annual retums for two of Vanguard's mutual funds: the Vanguard Energy Fund and the Vanguard Healthcare Fund. Use Table 2 Annual Total Returns (in percent) Year 2004 2005 2006 2007 2008 Energy x 31.40 20.20 18.25 34.00 -34.15 Healthcare y 9.45 14.26 9.72 4.42 -17.42 x13.94 27.74 -4.09 Sy 12.52 Sxy 305.64 SOURCE: www.finance.yahoo.com. Calculate and interpret the sample correlation coefficient rxy (Round intermediate calculations to at least 4 decimal...
The following table lists a portion of Major League Baseball’s (MLB’s) leading pitchers, each pit...
 The following table lists a portion of Major League Baseball’s
(MLB’s) leading pitchers, each pitcher’s salary (In $ millions),
and earned run average (ERA) for 2008.
Salary
ERA
J. Santana
16.0
2.46
C. Lee
3.0
2.31
⋮
⋮
⋮
C. Hamels
0.4
2.72
a-1. Estimate the model: Salary =
β0 + β1ERA + ε.
(Negative values should be indicated by a minus sign. Enter
your answers, in millions, rounded to 2 decimal
places.)
The following table lists a portion of...
The following table lists a portion of Major League Baseball’s
(MLB’s) leading pitchers, each pitcher’s salary (In $ millions),
and earned run average (ERA) for 2008.
Salary
ERA
J. Santana
16.0
2.46
C. Lee
3.0
2.31
⋮
⋮
⋮
C. Hamels
0.4
2.72
a-1. Estimate the model: Salary =
β0 + β1ERA + ε.
(Negative values should be indicated by a minus sign. Enter
your answers, in millions, rounded to 2 decimal
places.)
The following table lists a portion of...
13. The following table lists a portion of Major League Baseball’s (MLB’s) leading pitchers, each pitcher’s...
13. The following table lists a portion of Major League Baseball’s (MLB’s) leading pitchers, each pitcher’s salary (In $ millions), and earned run average (ERA) for 2008. Salary ERA J. Santana 15.0 2.26 C. Lee 1.0 2.36 ⋮ ⋮ ⋮ C. Hamels 0.4 2.70 a-1. Estimate the model: Salary = β0 + β1ERA + ε. (Negative values should be indicated by a minus sign. Enter your answers, in millions, rounded to 2 decimal places.) Salaryˆ=Salary^= + ERA a-2. Interpret the coefficient of...
The following table lists a portion of Major League Baseball’s (MLB’s) leading pitchers, each pitcher’s salary...
The following table lists a portion of Major League Baseball’s (MLB’s) leading pitchers, each pitcher’s salary (In $ millions), and earned run average (ERA) for 2008. Salary ERA J. Santana 10.0 2.51 C. Lee 3.0 2.52 ⋮ ⋮ ⋮ C. Hamels 0.4 2.83 a-1. Estimate the model: Salary = β0 + β1ERA + ε. (Negative values should be indicated by a minus sign. Enter your answers, in millions, rounded to 2 decimal places.) Salary = ________ + ______ ERA. a-2....
The following table lists a portion of Major League Baseball’s (MLB’s) leading pitchers, each pitcher’s salary...
The following table lists a portion of Major League Baseball’s (MLB’s) leading pitchers, each pitcher’s salary (In $ millions), and earned run average (ERA) for 2008. Salary ERA J. Santana 11.0 2.22 C. Lee 2.0 2.35 T. Lincecum 0.1 2.22 C. Sabathia 7.0 2.07 R. Halladay 6.0 2.33 J. Peavy 5.0 2.57 D. Matsuzaka 8.0 2.84 R. Dempster 6.6 2.34 B. Sheets 10.9 2.51 C. Hamels 0.5 2.91 a-1. Estimate the model: Salary = β0 + β1ERA + ε. (Negative...
last question fails to reject or reject and sufficient and insufficient. The accompanying data table lists...
 last question fails to reject or reject and sufficient and
insufficient.
The accompanying data table lists measured voltage amounts supplied directly to a family's home. The power supply company states that it has a target power supply of 120 volts. Using those home voltage amounts test the claim that the mean is 120 volts. Use a 0.01 significance level Click the icon to view the sample data. Cick the icon to viewa table of crtical 1-values What are the nul...
last question fails to reject or reject and sufficient and
insufficient.
The accompanying data table lists measured voltage amounts supplied directly to a family's home. The power supply company states that it has a target power supply of 120 volts. Using those home voltage amounts test the claim that the mean is 120 volts. Use a 0.01 significance level Click the icon to view the sample data. Cick the icon to viewa table of crtical 1-values What are the nul...
The accompanying data table lists the magnitudes of 50 earthquakes measured on the Richter scale. Test...
 The accompanying data table lists the magnitudes of 50 earthquakes measured on the Richter scale. Test the claim that the population of earthquakes has a mean magnitude greater than 1.00. Use a 0.05 significance level. Identify the null hypothesis, alternative hypothesis, test statistic, P-value, and conclusion for the test. Assume this is a simple random sample. Click the icon to view the sample data What are the hypotheses? O B. Ho u + 1.00 in magnitude H:u= 1.00 in magnitude...
Consider the following competing hypotheses and accompanying sample data drawn independently from normally distributed populations. (You may find it useful to reference the appropriate table: z table or t table)
 Consider the following competing hypotheses and accompanying sample data drawn independently from normally distributed populations. (You may find it useful to reference the appropriate table: z table or t table) H0: μ1 − μ2 = 0HA: μ1 − μ2 ≠ 0 x−1x−1 = 57x−2 = 63σ1 = 11.5σ2 = 15.2n1 = 20n2 = 20a-1. Calculate the value of the test statistic. (Negative values should be indicated by a minus sign. Round all intermediate calculations to at least 4 decimal places and final answer to 2 decimal places.)Test Statistic ?
 An investor owns a portfolio consisting of two mutual funds, A
and B, with 60% invested in A. The following table lists the inputs
for these funds.
An investor owns a portfolio consisting of two mutual funds, A and B, with 60% invested in A. The following table lists the inputs for these funds. Fund B Fund A 30 Measures Expected value Variance Covariance 24 49 87 36 a. Calculate the expected value for the portfolio return. (Round your answer...
An investor owns a portfolio consisting of two mutual funds, A
and B, with 60% invested in A. The following table lists the inputs
for these funds.
An investor owns a portfolio consisting of two mutual funds, A and B, with 60% invested in A. The following table lists the inputs for these funds. Fund B Fund A 30 Measures Expected value Variance Covariance 24 49 87 36 a. Calculate the expected value for the portfolio return. (Round your answer...
 Need in the next hour.
The following table shows the annual retums for two of Vanguard's mutual funds: the Vanguard Energy Fund and the Vanguard Healthcare Fund. Use Table 2 Annual Total Returns (in percent) Year 2004 2005 2006 2007 2008 Energy x 31.40 20.20 18.25 34.00 -34.15 Healthcare y 9.45 14.26 9.72 4.42 -17.42 x13.94 27.74 -4.09 Sy 12.52 Sxy 305.64 SOURCE: www.finance.yahoo.com. Calculate and interpret the sample correlation coefficient rxy (Round intermediate calculations to at least 4 decimal...
Need in the next hour.
The following table shows the annual retums for two of Vanguard's mutual funds: the Vanguard Energy Fund and the Vanguard Healthcare Fund. Use Table 2 Annual Total Returns (in percent) Year 2004 2005 2006 2007 2008 Energy x 31.40 20.20 18.25 34.00 -34.15 Healthcare y 9.45 14.26 9.72 4.42 -17.42 x13.94 27.74 -4.09 Sy 12.52 Sxy 305.64 SOURCE: www.finance.yahoo.com. Calculate and interpret the sample correlation coefficient rxy (Round intermediate calculations to at least 4 decimal...
 The following table lists a portion of Major League Baseball’s
(MLB’s) leading pitchers, each pitcher’s salary (In $ millions),
and earned run average (ERA) for 2008.
Salary
ERA
J. Santana
16.0
2.46
C. Lee
3.0
2.31
⋮
⋮
⋮
C. Hamels
0.4
2.72
a-1. Estimate the model: Salary =
β0 + β1ERA + ε.
(Negative values should be indicated by a minus sign. Enter
your answers, in millions, rounded to 2 decimal
places.)
The following table lists a portion of...
The following table lists a portion of Major League Baseball’s
(MLB’s) leading pitchers, each pitcher’s salary (In $ millions),
and earned run average (ERA) for 2008.
Salary
ERA
J. Santana
16.0
2.46
C. Lee
3.0
2.31
⋮
⋮
⋮
C. Hamels
0.4
2.72
a-1. Estimate the model: Salary =
β0 + β1ERA + ε.
(Negative values should be indicated by a minus sign. Enter
your answers, in millions, rounded to 2 decimal
places.)
The following table lists a portion of...
 last question fails to reject or reject and sufficient and
insufficient.
The accompanying data table lists measured voltage amounts supplied directly to a family's home. The power supply company states that it has a target power supply of 120 volts. Using those home voltage amounts test the claim that the mean is 120 volts. Use a 0.01 significance level Click the icon to view the sample data. Cick the icon to viewa table of crtical 1-values What are the nul...
last question fails to reject or reject and sufficient and
insufficient.
The accompanying data table lists measured voltage amounts supplied directly to a family's home. The power supply company states that it has a target power supply of 120 volts. Using those home voltage amounts test the claim that the mean is 120 volts. Use a 0.01 significance level Click the icon to view the sample data. Cick the icon to viewa table of crtical 1-values What are the nul...
 The accompanying data table lists the magnitudes of 50 earthquakes measured on the Richter scale. Test the claim that the population of earthquakes has a mean magnitude greater than 1.00. Use a 0.05 significance level. Identify the null hypothesis, alternative hypothesis, test statistic, P-value, and conclusion for the test. Assume this is a simple random sample. Click the icon to view the sample data What are the hypotheses? O B. Ho u + 1.00 in magnitude H:u= 1.00 in magnitude...
Most questions answered within 3 hours.
-
You're examining some of the tiny printing on one of the newer
twenty-dollar bills. A 1.5...
asked 1 minute from now -
Discuss several common sources of secondary data coming from
government sources.
asked 1 minute ago -
This is a basic java program where you convert units using only
loops, control statements and...
asked 1 minute ago -
A sample survey at a supermarket showed that 204 of 300 shoppers
regularly use cents-off coupons....
asked 46 minutes ago -
1. Find the area under the standard normal curve that lies
outside the interval between z=...
asked 18 minutes ago -
In ________ mode, the interpreter reads the contents of a file
that contains Python statements and...
asked 33 minutes ago -
1.
The second-order rate constant for self-reaction of hydroxyl
radicals
2 OH → H2O + O...
asked 23 minutes ago -
What is the most important factor leading to improved resource
efficiency over the long run?
asked 20 minutes ago -
Defend the effectiveness of teamwork in an organization.
(Use no more than 30 words)
asked 21 minutes ago -
Promotional strategies can assist in moving a product through
the channel of distribution. (a) Briefly explain...
asked 22 minutes ago -
Discuss why new and improved security measures are not enough to
stop online crime, What is...
asked 27 minutes ago -
A person whose weight is 516 N is being pulled up vertically by
a rope from...
asked 40 minutes ago