
Homework Answers
(a) Type II error means fail to reject null hypothesis when null hypothesis is false. So Option C.
Your answer is correct.
(b)

Add Answer to:
please right the answer that i can understand please
In December 2004, 39% of students in...
please right the answer clear In December 2004, 39% of students in high school were satisfied...
 please right the answer clear
In December 2004, 39% of students in high school were satisfied with the lunches supplied through the school. In May 2010, an organization conducted a poll of 851 students in high school and asked if they were satisfied with the lunches supplied through the school of the 851 surveyed, 298 indicated they were satisfied. Does thi suggest the proportion of students satisfied with the quality of lunches has decreased? (a) What does it mean to...
please right the answer clear
In December 2004, 39% of students in high school were satisfied with the lunches supplied through the school. In May 2010, an organization conducted a poll of 851 students in high school and asked if they were satisfied with the lunches supplied through the school of the 851 surveyed, 298 indicated they were satisfied. Does thi suggest the proportion of students satisfied with the quality of lunches has decreased? (a) What does it mean to...
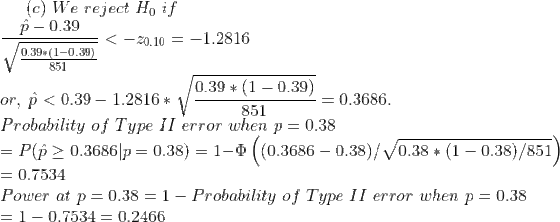
To test Ho: p=0.35 versus Hy:p>0.35, a simple random sample of n = 200 individuals is obtained and x = 69 successes are observed. (a) What does it mean to make a Type Il error for this test? (b) If the researcher decides to test this hypothesis at the a =
 To test Ho: p=0.35 versus Hy:p>0.35, a simple random sample of n = 200 individuals is obtained and x = 69 successes are observed. (a) What does it mean to make a Type Il error for this test? (b) If the researcher decides to test this hypothesis at the a = 0.01 level of significance, compute the probability of making a Type II error, B, if the true population proportion is 0.38. What is the power of the test? (c)...
10 o For students who first enrolled in two year public institutions in a recent semester,...
 10
o For students who first enrolled in two year public institutions in a recent semester, the proportion who earned a bachelor's degree within six years was 0.395. The president of a certain college believes that the proportion of students who enroll in her institution have a lower completion rate. (a) Determine the null and alternative hypotheses. (b) Explain what it would mean to make a Type I error. (c) Explain what it would mean to make a Type Il...
10
o For students who first enrolled in two year public institutions in a recent semester, the proportion who earned a bachelor's degree within six years was 0.395. The president of a certain college believes that the proportion of students who enroll in her institution have a lower completion rate. (a) Determine the null and alternative hypotheses. (b) Explain what it would mean to make a Type I error. (c) Explain what it would mean to make a Type Il...
1. Conduct a test of the null hypothesis that the mean height for all students in...
1. Conduct a test of the null hypothesis that the mean height for all students in the Census at School database is equal to 155 cm vs the alternative that the mean Height is greater than 155 cm. Use a significance level of 0.05. a. State the null and alternative hypotheses. Ho: m = 155 Ha: m > 155 b. Provide the Statcrunch output table. Hypothesis test results: Variable Sample Mean Std. Err. DF T-Stat P-value Height 159.86 1.7311103 49...
A researcher wants to determine whether high school students who attend an SAT preparation course score...
A researcher wants to determine whether high school students who attend an SAT preparation course score significantly different on the SAT than students who do not attend the preparation course. For those who do not attend the course, the population mean is 1050 (? = 1050). The 16 students who attend the preparation course average 1200on the SAT, with a sample standard deviation of 100. On the basis of these data, can the researcher conclude that the preparation course has...
o pts Question 9 Suppose a random sample of 16 students had a mean height of...
 o pts Question 9 Suppose a random sample of 16 students had a mean height of 65.0 inches with a standard deviation of 4.1 inches. Estimate the population mean height of students using this sample, StatCrunch, and a 95% confidence level. Round the interval limits to the tenth. O 63.2 inches to 66.8 inches O 63.0 inches to 67.0 inches O 63.3 inches to 66.7 inches O 62.8 inches to 67.2 inches. Question 10 10 pts Suppose you wanted to...
10.2 A blind taste test is conducted to determine which of two colas, Brand A or...
 10.2
A blind taste test is conducted to determine which of two colas, Brand A or Brand B, individuals prefer. Individuals are randomly asked to drink one of the two types of cola first, followed by the other cola, and then asked to disclose the drink they prefer. Results of the taste test indicate that 48 of 100 individuals prefer Brand A. Complete parts a through c. Do not reject the null hypothesis for the values of po between 0.39...
10.2
A blind taste test is conducted to determine which of two colas, Brand A or Brand B, individuals prefer. Individuals are randomly asked to drink one of the two types of cola first, followed by the other cola, and then asked to disclose the drink they prefer. Results of the taste test indicate that 48 of 100 individuals prefer Brand A. Complete parts a through c. Do not reject the null hypothesis for the values of po between 0.39...
Please help Describe type I and type Il errors for a hypothesis test of the indicated...
 Please help
Describe type I and type Il errors for a hypothesis test of the indicated claim. A clothing store claims that at least 80% of its new customers will return to buy their next article of clothing. Describe the type error. Choose the correct answer below. O A. A type I error will occur when the actual proportion of new customers who return to buy their next article of clothing is no more than 0.80, but you reject Ho:ps...
Please help
Describe type I and type Il errors for a hypothesis test of the indicated claim. A clothing store claims that at least 80% of its new customers will return to buy their next article of clothing. Describe the type error. Choose the correct answer below. O A. A type I error will occur when the actual proportion of new customers who return to buy their next article of clothing is no more than 0.80, but you reject Ho:ps...
An accounting class of 250 students is allocated into several tutorials to be taken by either...
 An accounting class of 250 students is allocated into several tutorials to be taken by either Tutor A and Tutor B. At the end of the semester the lecturer-in-charge looks at the distribution of marks by tutor. Table 1 provides this summary of the marks Table 1: Accounting student results according to their tutor Fail Credit Distinction Higher distinction 1 4 Pass Total Tutor A Tutor B Total 13 12 25 59 71 130 26 39 65 6 19 25...
Part (V) to (Viii) An accounting class of 250 students is allocated into several tutorials to...
 Part (V) to (Viii)
An accounting class of 250 students is allocated into several tutorials to be taken by either Tutor A and Tutor B. At the end of the semester the lecturer-in-charge looks at the distribution of marks by tutor. Table 1 provides this summary of the marks Table 1: Accounting student results according to their tutor Fail Credit Distinction Higher distinction 1 4 Pass Total Tutor A Tutor B Total 13 12 25 59 71 130 26 39...
Part (V) to (Viii)
An accounting class of 250 students is allocated into several tutorials to be taken by either Tutor A and Tutor B. At the end of the semester the lecturer-in-charge looks at the distribution of marks by tutor. Table 1 provides this summary of the marks Table 1: Accounting student results according to their tutor Fail Credit Distinction Higher distinction 1 4 Pass Total Tutor A Tutor B Total 13 12 25 59 71 130 26 39...
 please right the answer clear
In December 2004, 39% of students in high school were satisfied with the lunches supplied through the school. In May 2010, an organization conducted a poll of 851 students in high school and asked if they were satisfied with the lunches supplied through the school of the 851 surveyed, 298 indicated they were satisfied. Does thi suggest the proportion of students satisfied with the quality of lunches has decreased? (a) What does it mean to...
please right the answer clear
In December 2004, 39% of students in high school were satisfied with the lunches supplied through the school. In May 2010, an organization conducted a poll of 851 students in high school and asked if they were satisfied with the lunches supplied through the school of the 851 surveyed, 298 indicated they were satisfied. Does thi suggest the proportion of students satisfied with the quality of lunches has decreased? (a) What does it mean to...
 10
o For students who first enrolled in two year public institutions in a recent semester, the proportion who earned a bachelor's degree within six years was 0.395. The president of a certain college believes that the proportion of students who enroll in her institution have a lower completion rate. (a) Determine the null and alternative hypotheses. (b) Explain what it would mean to make a Type I error. (c) Explain what it would mean to make a Type Il...
10
o For students who first enrolled in two year public institutions in a recent semester, the proportion who earned a bachelor's degree within six years was 0.395. The president of a certain college believes that the proportion of students who enroll in her institution have a lower completion rate. (a) Determine the null and alternative hypotheses. (b) Explain what it would mean to make a Type I error. (c) Explain what it would mean to make a Type Il...
 o pts Question 9 Suppose a random sample of 16 students had a mean height of 65.0 inches with a standard deviation of 4.1 inches. Estimate the population mean height of students using this sample, StatCrunch, and a 95% confidence level. Round the interval limits to the tenth. O 63.2 inches to 66.8 inches O 63.0 inches to 67.0 inches O 63.3 inches to 66.7 inches O 62.8 inches to 67.2 inches. Question 10 10 pts Suppose you wanted to...
 10.2
A blind taste test is conducted to determine which of two colas, Brand A or Brand B, individuals prefer. Individuals are randomly asked to drink one of the two types of cola first, followed by the other cola, and then asked to disclose the drink they prefer. Results of the taste test indicate that 48 of 100 individuals prefer Brand A. Complete parts a through c. Do not reject the null hypothesis for the values of po between 0.39...
10.2
A blind taste test is conducted to determine which of two colas, Brand A or Brand B, individuals prefer. Individuals are randomly asked to drink one of the two types of cola first, followed by the other cola, and then asked to disclose the drink they prefer. Results of the taste test indicate that 48 of 100 individuals prefer Brand A. Complete parts a through c. Do not reject the null hypothesis for the values of po between 0.39...
 Please help
Describe type I and type Il errors for a hypothesis test of the indicated claim. A clothing store claims that at least 80% of its new customers will return to buy their next article of clothing. Describe the type error. Choose the correct answer below. O A. A type I error will occur when the actual proportion of new customers who return to buy their next article of clothing is no more than 0.80, but you reject Ho:ps...
Please help
Describe type I and type Il errors for a hypothesis test of the indicated claim. A clothing store claims that at least 80% of its new customers will return to buy their next article of clothing. Describe the type error. Choose the correct answer below. O A. A type I error will occur when the actual proportion of new customers who return to buy their next article of clothing is no more than 0.80, but you reject Ho:ps...
 An accounting class of 250 students is allocated into several tutorials to be taken by either Tutor A and Tutor B. At the end of the semester the lecturer-in-charge looks at the distribution of marks by tutor. Table 1 provides this summary of the marks Table 1: Accounting student results according to their tutor Fail Credit Distinction Higher distinction 1 4 Pass Total Tutor A Tutor B Total 13 12 25 59 71 130 26 39 65 6 19 25...
 Part (V) to (Viii)
An accounting class of 250 students is allocated into several tutorials to be taken by either Tutor A and Tutor B. At the end of the semester the lecturer-in-charge looks at the distribution of marks by tutor. Table 1 provides this summary of the marks Table 1: Accounting student results according to their tutor Fail Credit Distinction Higher distinction 1 4 Pass Total Tutor A Tutor B Total 13 12 25 59 71 130 26 39...
Part (V) to (Viii)
An accounting class of 250 students is allocated into several tutorials to be taken by either Tutor A and Tutor B. At the end of the semester the lecturer-in-charge looks at the distribution of marks by tutor. Table 1 provides this summary of the marks Table 1: Accounting student results according to their tutor Fail Credit Distinction Higher distinction 1 4 Pass Total Tutor A Tutor B Total 13 12 25 59 71 130 26 39...
Most questions answered within 3 hours.
-
An entomologist discovers a dung beetle rolling a ball of dung
along the ground, and decides...
asked 39 minutes ago -
Humans have used horses for transportation for millions of
years. Therefore, they will use horses for...
asked 2 hours ago -
The following are the Jensen Corporation's unit costs of making
and selling an item at a...
asked 3 hours ago -
Does direct Medicare reimbursement of Advanced practice nurses
increase access to their services?
asked 3 hours ago -
List and explain why a company would choose to use a
published
compensation survey vs. creating...
asked 4 hours ago -
A discrete random variable X can take values from 1 to 10. Find
the variance of...
asked 4 hours ago -
The primary financial goal of a corporation is to maximize:
shareholders wealth.
earnings per share.
stock...
asked 4 hours ago -
determine whether the vectors u=(1,2,3,), v=(-2,1,0) and
w=(1,0,1) are linearly dependent or independent.
asked 4 hours ago -
python
Define a function called print_values which takes a dictionary
object as a parameter. The function...
asked 5 hours ago -
In Chapter 1 you created a program named Triangle in
which you displayed a seven-line triangle...
asked 5 hours ago -
Research question: What are the differences between separately
stated and non separately stated transactions in an...
asked 5 hours ago -
By using Arduino write a code that connects two LEDs to two
push-buttons. Each button controls...
asked 6 hours ago