![Required information [The following information applies to the questions displayed below.] Income statement and balance sheet](http://img.homeworklib.com/questions/eb5f8500-8fe5-11eb-b884-2b99c74b453c.png?x-oss-process=image/resize,w_560) Also what do you think the
return of equity percentage would be? Thank you!
Also what do you think the
return of equity percentage would be? Thank you!
Homework Answers
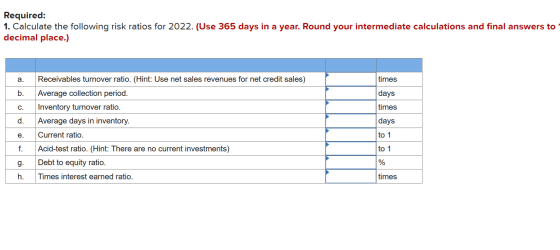
Based on the information available in the question, we can calculate the ratios for 2022 as follows:-
a.) Receivables Turnover Ratio:-
Credit Sales/Average Accounts Receivable
Average accounts receivable = ($48,680 + $0)/2
Average accounts receivable = $24,340
= $176,690/$24,340
=7.2592
Receivables turnover ratio = 7.3 times
b.) Average collection Period:-
Average collection period = 365/Accounts Receivables turnover
=365/7.3
=50
Average Collection Period =50 days
c.) Inventory Turnover Ratio
Inventory Turnover Ratio = Cost of Goods sold/Average stock
Average Stock = ($8,200 + $0)/2
Average Stock = $4,100
Inventory Turnover Ratio = $39,100/$4,100
Inventory Turnover Ratio = 9.536
Inventory Turnover ratio = 9.5(Rounded)
d.) Average days in Inventory
Average Days in inventory = 365/Inventory Turnover Ratio
=365/9.5
=38.421
Average days in inventory = 38.4 days
e.) Current Ratio
Current Ratio = Current Assets/Current Liabilities
| Current Assets | Amount |
| Cash | 231,844 |
| Accounts Receivable | 48,680 |
| Inventory | 8,200 |
| Other current assets | 1,020 |
| Total current assets | 289,744 |
| Current liabilities | Amount |
| Accounts Payable | 22,000 |
| Interest payable | 1,050 |
| Income tax payable | 15,100 |
| Other current liabilities | 24,600 |
| Notes payable(current) | 60,137 |
| Total current assets | 122,887 |
Current Ratio = $289,744/$122,887
Current Ratio = 2.3578
Current Ratio = 2.4 times
Please note that we have to answer a minimum of 4 questions per Chegg answering guidelines which have been answered above. Kindly request you to post the remaining questions separately so that we can answer them as well. All the best and please let me know if you have any questions via comments :)
Add Answer to:
Also what do you think the
return of equity percentage would be? Thank you!
Required: 1....
Great Adventures Problem AP12-1 [The following information applies to the questions displayed below.] Income statement and...
Great Adventures Problem AP12-1 [The following information applies to the questions displayed below.] Income statement and balance sheet data for Great Adventures, Inc., are provided below. GREAT ADVENTURES, INC. Income Statement For the year ended December 31, 2022 Net sales revenues $ 191,320 Interest revenue 380 Expenses: Cost of goods sold $ 39,800 Operating expenses 67,260 Depreciation expense 18,550 Interest expense 10,027 Income tax expense 15,800 Total expenses 151,437 Net income $ 40,263 GREAT ADVENTURES, INC. Balance Sheets December 31,...
Income statement and balance sheet data for Great Adventures, Inc., are provided below. GREAT ADVENTURES, INC....
 Income statement and balance sheet data for Great Adventures, Inc., are provided below. GREAT ADVENTURES, INC. Income Statement For the Year Ended December 31, 2020 Revenues: Service revenue (clinic, racing, TEAM) $527,000 Sales revenue (MU watches) 102,000 $629,000 Total revenues Expenses: Cost of goods sold (MU watches) Operating expenses Depreciation expense Interest expense Income tax expense 62,000 303,476 42,000 28,924 52,200 Total expenses 488,600 Net income $140,400 GREAT ADVENTURES, INC. Balance Sheets December 31, 2020 and 2019 2020 2019 Increase...
Required information [The following information applies to the questions displayed below) Income statement and balance sheet...
 Required information [The following information applies to the questions displayed below) Income statement and balance sheet data for Great Adventures, Inc., are provided below. $168,330 160 GREAT ADVENTURES, INC. Income Statement For the year ended December 31, 2022 Net sales revenues Interest revenue Expenses: Cost of goods sold $38, 700 Operating expenses 53,840 Depreciation expense 17,450 Interest expense 7,284 Income tax expense 14,700 Total expenses Net income 131, 974 $ 36,516 GREAT MOVENTURES, INC. Balance Sheets December 31, 2022 and...
Great Adventures Problem AP12-1 [The following information applies to the questions displayed below) Income statement and...
 Great Adventures Problem AP12-1 [The following information applies to the questions displayed below) Income statement and balance sheet data for Great Adventures, Inc., ore provided below. $193,410 GREAT ADVENTURES, INC. Income statenent For the year ended December 31, 2022 Net sales revenues Interest revenue Expenses: Cost of goods sold $39,900 Operating expenses 68,480 Depreciation expense 18,65e Interest expense 1e, 276 Income tax expense 15,980 Total expenses Net income 153,206 $ 40,684 GREAT ADVENTURES, INC. Balance Sheets December 31, 2022 and...
[The following information applies to the questions displayed below.] Income statement and balance sheet data for Great Adventures, Inc., are provided below. GREAT ADVENTURES, INC. Income Statement...
 [The following information applies to the questions
displayed below.]
Income statement and balance sheet data for Great Adventures,
Inc., are provided below.
GREAT ADVENTURES, INC.
Income Statement
For the Year Ended December 31, 2020
Revenues:
Service revenue (clinic, racing,
TEAM)
$535,000
Sales revenue (MU watches)
110,000
Total
revenues
$645,000
Expenses:
Cost of goods sold (MU
watches)
66,000
Operating expenses
303,876
Depreciation expense
46,000
Interest expense
29,324
Income tax expense
54,600
Total
expenses
499,800
Net income
$145,200
GREAT ADVENTURES, INC.
Balance...
[The following information applies to the questions
displayed below.]
Income statement and balance sheet data for Great Adventures,
Inc., are provided below.
GREAT ADVENTURES, INC.
Income Statement
For the Year Ended December 31, 2020
Revenues:
Service revenue (clinic, racing,
TEAM)
$535,000
Sales revenue (MU watches)
110,000
Total
revenues
$645,000
Expenses:
Cost of goods sold (MU
watches)
66,000
Operating expenses
303,876
Depreciation expense
46,000
Interest expense
29,324
Income tax expense
54,600
Total
expenses
499,800
Net income
$145,200
GREAT ADVENTURES, INC.
Balance...
The comparative statements of Sheridan Company are presented here. SHERIDAN COMPANY Income Statements For the Years...
 The comparative statements of Sheridan Company are presented
here.
SHERIDAN COMPANY
Income Statements
For the Years Ended December 31
2022
2021
Net sales
$1,734,400
$1,610,000
Cost of goods sold
967,000
925,520
Gross profit
767,400
684,480
Selling and administrative expenses
460,000
440,680
Income from operations
307,400
243,800
Other expenses and losses
Interest expense
20,240
18,400
Income before income taxes
287,160
225,400
Income tax expense
86,148
67,620
Net income
$ 201,012
$ 157,780
SHERIDAN COMPANY
Balance Sheets
December 31
Assets
2022
2021...
The comparative statements of Sheridan Company are presented
here.
SHERIDAN COMPANY
Income Statements
For the Years Ended December 31
2022
2021
Net sales
$1,734,400
$1,610,000
Cost of goods sold
967,000
925,520
Gross profit
767,400
684,480
Selling and administrative expenses
460,000
440,680
Income from operations
307,400
243,800
Other expenses and losses
Interest expense
20,240
18,400
Income before income taxes
287,160
225,400
Income tax expense
86,148
67,620
Net income
$ 201,012
$ 157,780
SHERIDAN COMPANY
Balance Sheets
December 31
Assets
2022
2021...
Problem 13-02A The comparative statements of Cullumber Company are presented here. CULLUMBER COMPANY Income Statements For...
 Problem 13-02A
The comparative statements of Cullumber Company are presented
here.
CULLUMBER COMPANY
Income Statements
For the Years Ended December 31
2022
2021
Net sales
$1,586,400
$1,470,000
Cost of goods sold
887,000
845,040
Gross profit
699,400
624,960
Selling and administrative expenses
420,000
402,360
Income from operations
279,400
222,600
Other expenses and losses
Interest expense
18,480
16,800
Income before income taxes
260,920
205,800
Income tax expense
78,276
61,740
Net income
$ 182,644
$ 144,060
CULLUMBER COMPANY
Balance Sheets
December 31
Assets...
Problem 13-02A
The comparative statements of Cullumber Company are presented
here.
CULLUMBER COMPANY
Income Statements
For the Years Ended December 31
2022
2021
Net sales
$1,586,400
$1,470,000
Cost of goods sold
887,000
845,040
Gross profit
699,400
624,960
Selling and administrative expenses
420,000
402,360
Income from operations
279,400
222,600
Other expenses and losses
Interest expense
18,480
16,800
Income before income taxes
260,920
205,800
Income tax expense
78,276
61,740
Net income
$ 182,644
$ 144,060
CULLUMBER COMPANY
Balance Sheets
December 31
Assets...
does not indicate completion. Return to questi Required information [The following information applies to the questions...
 does not indicate completion. Return to questi Required information [The following information applies to the questions displayed below.] Part 1 of 2 10 points Income statements and balance sheets data for Virtual Gaming Systems are provided below. VIRTUAL GAMING SYSTEMS Income Statements For the years ended December 31 2022 2021 Net sales $3,555,000 $3,081,000 Cost of goods sold 2,489,000 1,959,000 Gross profit 1,066,000 1, 122,000 Expenses: Operating expenses 964,000 867,000 Depreciation expense 39,000 31,500 Loss on sale of land 8,900...
Thank you The comparative statements of Wahlberg Company are presented here. Wahlberg Company Income Statement For...
 Thank you
The comparative statements of Wahlberg Company are presented here. Wahlberg Company Income Statement For the Years Ended December 31 2020 2019 Net sales Cost of goods sold Gross profit Selling and administrative expenses Income from operations Other expenses and losses Interest expense Income before income taxes Income tax expense $1,813,600 1,007,100 806,500 519,800 286,700 $1,750,700 978,000 772,700 472,000 300,700 17,100 269,600 80,015 $ 189,585 14,200 286,500 77,500 $ 209,000 Net income 2019 $64,600 50,300 102,800 115,600 333,300 523,900...
Thank you
The comparative statements of Wahlberg Company are presented here. Wahlberg Company Income Statement For the Years Ended December 31 2020 2019 Net sales Cost of goods sold Gross profit Selling and administrative expenses Income from operations Other expenses and losses Interest expense Income before income taxes Income tax expense $1,813,600 1,007,100 806,500 519,800 286,700 $1,750,700 978,000 772,700 472,000 300,700 17,100 269,600 80,015 $ 189,585 14,200 286,500 77,500 $ 209,000 Net income 2019 $64,600 50,300 102,800 115,600 333,300 523,900...
The comparative statements of Sheridan Company are presented here. SHERIDAN COMPANY Income Statements For the Years...
 The comparative statements of Sheridan Company are presented here. SHERIDAN COMPANY Income Statements For the Years Ended December 31 2022 Net sales $1,734,400 Cost of goods sold 967,000 Gross profit 767,400 Selling and administrative expenses 460,000 Income from operations 307,400 Other expenses and losses Interest expense 20,240 Income before income taxes 287,160 Income tax expense 86,148 Net income $ 201,012 2021 $1,610,000 925,520 684,480 440,680 243,800 18,400 225,400 67.620 $ 157,780 2021 SHERIDAN COMPANY Balance Sheets December 31 Assets 2022...
 Income statement and balance sheet data for Great Adventures, Inc., are provided below. GREAT ADVENTURES, INC. Income Statement For the Year Ended December 31, 2020 Revenues: Service revenue (clinic, racing, TEAM) $527,000 Sales revenue (MU watches) 102,000 $629,000 Total revenues Expenses: Cost of goods sold (MU watches) Operating expenses Depreciation expense Interest expense Income tax expense 62,000 303,476 42,000 28,924 52,200 Total expenses 488,600 Net income $140,400 GREAT ADVENTURES, INC. Balance Sheets December 31, 2020 and 2019 2020 2019 Increase...
 Required information [The following information applies to the questions displayed below) Income statement and balance sheet data for Great Adventures, Inc., are provided below. $168,330 160 GREAT ADVENTURES, INC. Income Statement For the year ended December 31, 2022 Net sales revenues Interest revenue Expenses: Cost of goods sold $38, 700 Operating expenses 53,840 Depreciation expense 17,450 Interest expense 7,284 Income tax expense 14,700 Total expenses Net income 131, 974 $ 36,516 GREAT MOVENTURES, INC. Balance Sheets December 31, 2022 and...
 Great Adventures Problem AP12-1 [The following information applies to the questions displayed below) Income statement and balance sheet data for Great Adventures, Inc., ore provided below. $193,410 GREAT ADVENTURES, INC. Income statenent For the year ended December 31, 2022 Net sales revenues Interest revenue Expenses: Cost of goods sold $39,900 Operating expenses 68,480 Depreciation expense 18,65e Interest expense 1e, 276 Income tax expense 15,980 Total expenses Net income 153,206 $ 40,684 GREAT ADVENTURES, INC. Balance Sheets December 31, 2022 and...
 [The following information applies to the questions
displayed below.]
Income statement and balance sheet data for Great Adventures,
Inc., are provided below.
GREAT ADVENTURES, INC.
Income Statement
For the Year Ended December 31, 2020
Revenues:
Service revenue (clinic, racing,
TEAM)
$535,000
Sales revenue (MU watches)
110,000
Total
revenues
$645,000
Expenses:
Cost of goods sold (MU
watches)
66,000
Operating expenses
303,876
Depreciation expense
46,000
Interest expense
29,324
Income tax expense
54,600
Total
expenses
499,800
Net income
$145,200
GREAT ADVENTURES, INC.
Balance...
[The following information applies to the questions
displayed below.]
Income statement and balance sheet data for Great Adventures,
Inc., are provided below.
GREAT ADVENTURES, INC.
Income Statement
For the Year Ended December 31, 2020
Revenues:
Service revenue (clinic, racing,
TEAM)
$535,000
Sales revenue (MU watches)
110,000
Total
revenues
$645,000
Expenses:
Cost of goods sold (MU
watches)
66,000
Operating expenses
303,876
Depreciation expense
46,000
Interest expense
29,324
Income tax expense
54,600
Total
expenses
499,800
Net income
$145,200
GREAT ADVENTURES, INC.
Balance...
 The comparative statements of Sheridan Company are presented
here.
SHERIDAN COMPANY
Income Statements
For the Years Ended December 31
2022
2021
Net sales
$1,734,400
$1,610,000
Cost of goods sold
967,000
925,520
Gross profit
767,400
684,480
Selling and administrative expenses
460,000
440,680
Income from operations
307,400
243,800
Other expenses and losses
Interest expense
20,240
18,400
Income before income taxes
287,160
225,400
Income tax expense
86,148
67,620
Net income
$ 201,012
$ 157,780
SHERIDAN COMPANY
Balance Sheets
December 31
Assets
2022
2021...
The comparative statements of Sheridan Company are presented
here.
SHERIDAN COMPANY
Income Statements
For the Years Ended December 31
2022
2021
Net sales
$1,734,400
$1,610,000
Cost of goods sold
967,000
925,520
Gross profit
767,400
684,480
Selling and administrative expenses
460,000
440,680
Income from operations
307,400
243,800
Other expenses and losses
Interest expense
20,240
18,400
Income before income taxes
287,160
225,400
Income tax expense
86,148
67,620
Net income
$ 201,012
$ 157,780
SHERIDAN COMPANY
Balance Sheets
December 31
Assets
2022
2021...
 Problem 13-02A
The comparative statements of Cullumber Company are presented
here.
CULLUMBER COMPANY
Income Statements
For the Years Ended December 31
2022
2021
Net sales
$1,586,400
$1,470,000
Cost of goods sold
887,000
845,040
Gross profit
699,400
624,960
Selling and administrative expenses
420,000
402,360
Income from operations
279,400
222,600
Other expenses and losses
Interest expense
18,480
16,800
Income before income taxes
260,920
205,800
Income tax expense
78,276
61,740
Net income
$ 182,644
$ 144,060
CULLUMBER COMPANY
Balance Sheets
December 31
Assets...
Problem 13-02A
The comparative statements of Cullumber Company are presented
here.
CULLUMBER COMPANY
Income Statements
For the Years Ended December 31
2022
2021
Net sales
$1,586,400
$1,470,000
Cost of goods sold
887,000
845,040
Gross profit
699,400
624,960
Selling and administrative expenses
420,000
402,360
Income from operations
279,400
222,600
Other expenses and losses
Interest expense
18,480
16,800
Income before income taxes
260,920
205,800
Income tax expense
78,276
61,740
Net income
$ 182,644
$ 144,060
CULLUMBER COMPANY
Balance Sheets
December 31
Assets...
 does not indicate completion. Return to questi Required information [The following information applies to the questions displayed below.] Part 1 of 2 10 points Income statements and balance sheets data for Virtual Gaming Systems are provided below. VIRTUAL GAMING SYSTEMS Income Statements For the years ended December 31 2022 2021 Net sales $3,555,000 $3,081,000 Cost of goods sold 2,489,000 1,959,000 Gross profit 1,066,000 1, 122,000 Expenses: Operating expenses 964,000 867,000 Depreciation expense 39,000 31,500 Loss on sale of land 8,900...
 Thank you
The comparative statements of Wahlberg Company are presented here. Wahlberg Company Income Statement For the Years Ended December 31 2020 2019 Net sales Cost of goods sold Gross profit Selling and administrative expenses Income from operations Other expenses and losses Interest expense Income before income taxes Income tax expense $1,813,600 1,007,100 806,500 519,800 286,700 $1,750,700 978,000 772,700 472,000 300,700 17,100 269,600 80,015 $ 189,585 14,200 286,500 77,500 $ 209,000 Net income 2019 $64,600 50,300 102,800 115,600 333,300 523,900...
Thank you
The comparative statements of Wahlberg Company are presented here. Wahlberg Company Income Statement For the Years Ended December 31 2020 2019 Net sales Cost of goods sold Gross profit Selling and administrative expenses Income from operations Other expenses and losses Interest expense Income before income taxes Income tax expense $1,813,600 1,007,100 806,500 519,800 286,700 $1,750,700 978,000 772,700 472,000 300,700 17,100 269,600 80,015 $ 189,585 14,200 286,500 77,500 $ 209,000 Net income 2019 $64,600 50,300 102,800 115,600 333,300 523,900...
 The comparative statements of Sheridan Company are presented here. SHERIDAN COMPANY Income Statements For the Years Ended December 31 2022 Net sales $1,734,400 Cost of goods sold 967,000 Gross profit 767,400 Selling and administrative expenses 460,000 Income from operations 307,400 Other expenses and losses Interest expense 20,240 Income before income taxes 287,160 Income tax expense 86,148 Net income $ 201,012 2021 $1,610,000 925,520 684,480 440,680 243,800 18,400 225,400 67.620 $ 157,780 2021 SHERIDAN COMPANY Balance Sheets December 31 Assets 2022...
Most questions answered within 3 hours.
-
An explosion breaks a 20.0-kg object into three parts. The
object is initially moving at a...
asked 39 minutes ago -
Calculate the approximate number of residues of Rubisco, which
is involved in carbon fixation in plants,...
asked 1 hour ago -
Other decisions about scientific claims can have a much broader
impact.ENERGYarrow-10x10.png, environment, health, security - all...
asked 2 hours ago -
I need to write a research paper and work cited about this
topic: The United States...
asked 2 hours ago -
Hello! I was wondering if I could have some help?
If the vapor pressure of carvone...
asked 3 hours ago -
An economist wants to estimate the mean per capita income (in
thousands of dollars) for a...
asked 3 hours ago -
What would be the input/output characteristic of a circuit
obtained by putting two of your 2's-complementers...
asked 3 hours ago -
In Drosophila, the transition from the syncytial blastoderm
stage to the cellular blastoderm stage is a...
asked 4 hours ago -
Project management question:
Name 3 different types of resources (hint: humans are one
type)
asked 4 hours ago -
Consider the following reaction: C 2H 2( g) + 2H 2( g) C 2H 6(
g)...
asked 4 hours ago -
Consider a 1.0 L buffer containing 0.092 mol L-1 HCOOH and 0.100
mol L-1 HCOO-. What...
asked 4 hours ago -
Koch Realty has owned a vacant land with a FMV of
$775,000 and an adjusted basis...
asked 4 hours ago