
Homework Answers


Add Answer to:
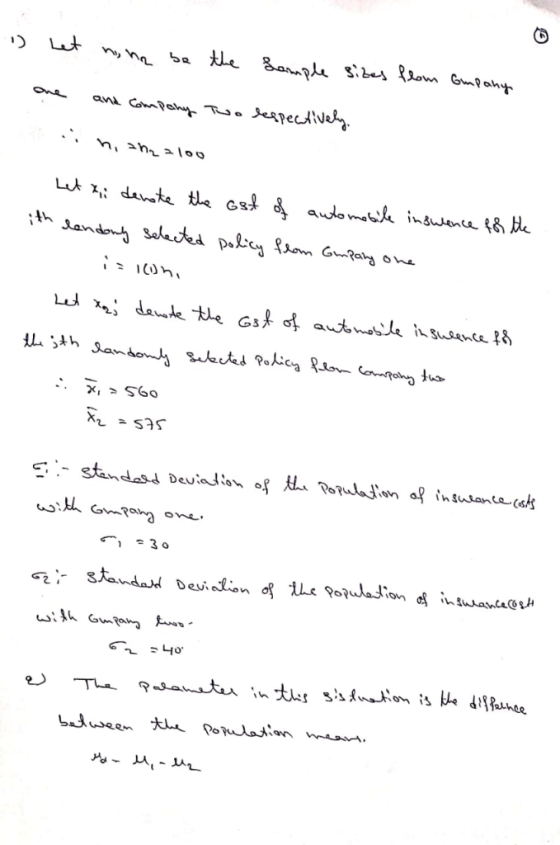
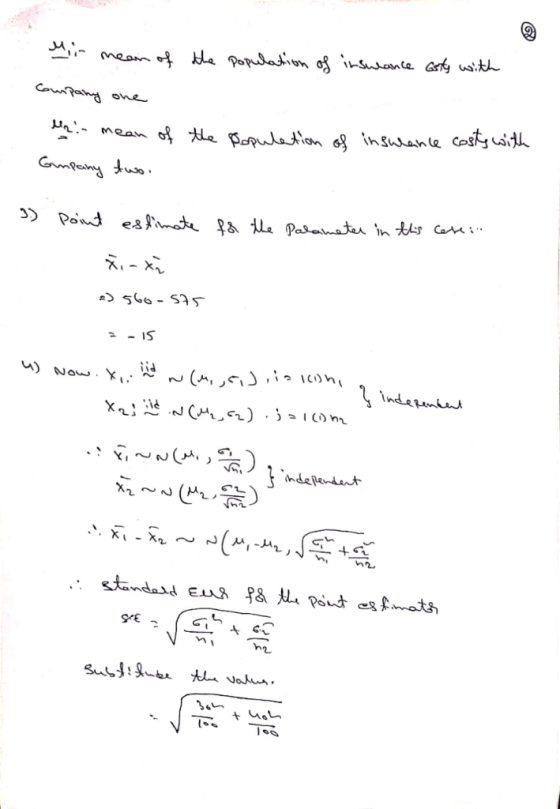
length. The difference between the mean costs of automobile insurance for a similar vehicle and driver...
A random sample of size n= 15 obtained from a population that is normally distributed results...
 A random sample of size n= 15 obtained from a population that is normally distributed results in a sample mean of 45.8 and sample standard deviation 12.2. An independent sample of size n = 20 obtained from a population that is normally distributed results in a sample mean of 51.9 and sample standard deviation 14.6. Does this constitute sufficient evidence to conclude that the population means differ at the a = 0.05 level of significance? Click here to view the...
2. [25 POINTS = 15+101 BONNIE (WHO WORKS AS INSURANCE ANALYST) COLLECTED DATA FOR TWO INDEPENDENT...
 2. [25 POINTS = 15+101 BONNIE (WHO WORKS AS INSURANCE ANALYST) COLLECTED DATA FOR TWO INDEPENDENT GROUPS OF CAR POLICIES, EACH GROUPS INCLUDED n1 = n2 8 MONTHLY PREMIUM VALUES. BONNIE ASSUMED THAT THE POPULATION VARIANCES FOR TWO GROUPS ARE KNOWN AS (σ)-(o2)2 = 9 SAMPLE SUMMARIES WERE FOUND AS FOLLOWS (SAMPLE MEAN FOR GROUP I) = 33.40 AND (SAMPLE VARIANCE) = 7 (SAMPLE MEAN FOR GROUP II)-37.30 AND (SAMPLE VARIANCE)-11 AT THE 1% SIGNIFICANCE LEVEL, DOES BONNIE HAVE SUFFICIENT...
INFERENCES ABOUT THE POPULATION MEAN DISTINGUISH BETWEEN Z-TEST AND T-TEST. 1. A GROUP OF 9 STORE...
INFERENCES ABOUT THE POPULATION MEAN DISTINGUISH BETWEEN Z-TEST AND T-TEST. 1. A GROUP OF 9 STORE MANAGERS WAS DRAWN FOR ANALYSIS OF THEIR IQ SCORES. ASSUME THAT INDIVIDUAL SCORES ARE NORMALLY DISTRIBUTED, WITH THE UNKNOWN POPULATION AVERAGE AND POPULATION STANDARD DEVIATION OF 15. SAMPLE SUMMARIES WERE: (SAMPLE MEAN) = 88.2 AND (SAMPLE STANDARD DEVIATION) = 12. (A) AT THE 1% SIGNIFICANCE LEVEL, DO WE HAVE SUFFICIENT EVIDENCE THAT THE POPULATION AVERAGE IQ WAS BELOW 100? CIRCLE ONE: YES! || NO!...
i need 9 though 15 please and thank you STAT 2480 Chapter 9: Significance Tests About...
 i need 9 though 15 please and thank you
STAT 2480 Chapter 9: Significance Tests About Hypotheses Across 1. In a significance test, the null hypothesis is presumed to unless the data give strong evidence against it. Down 2. The hypothesis is usually a statement of no treatment effect the null hypothesis 3. A Type 1 Error is when we when it is true. 4. When the null hypothesis is rejected because the P- value is less than or equal...
i need 9 though 15 please and thank you
STAT 2480 Chapter 9: Significance Tests About Hypotheses Across 1. In a significance test, the null hypothesis is presumed to unless the data give strong evidence against it. Down 2. The hypothesis is usually a statement of no treatment effect the null hypothesis 3. A Type 1 Error is when we when it is true. 4. When the null hypothesis is rejected because the P- value is less than or equal...
A 90% confidence interval for the difference between the means of two independent populations with unknown...
A 90% confidence interval for the difference between the means of two independent populations with unknown population standard deviations is found to be (-0.2, 5.4). Which of the following statements is/are correct? CHECK ALL THAT APPLY. A. The null hypothesis that the two population means are equal is not rejected at the 10% significance level using a two-sided paired tt-test. B. The null hypothesis that the two population means are equal is rejected at the 10% significance level using a...
A cereal company claims that the mean weight of the cereal in its packets is more...
A cereal company claims that the mean weight of the cereal in its packets is more than 14 oz. The weights (in oz) of the cereal in a random sample of 8 cereal packets are listed below. You may assume the sample data comes from a population that follows a normal distribution. Using a 0.05 significance level, test the companies claim. State the null hypothesis H0. State the alternative hypothesis H1. What is the test statistic? State the alpha level....
For a random sample of 36 data pairs, the sample mean of the differences was 0.72....
 For a random sample of 36 data pairs, the sample mean of the differences was 0.72. The sample standard deviation of the differences was 2. At the 5% level of significance, test the claim that the population mean of the differences is different from 0. (a) Is it appropriate to use a Student's t distribution for the sample test statistic? Explain. No, the sample size is not larger than 30. Yes, the sample size is larger than 30. No, the...
Question 22 3 pts Suppose you are interested in testing a null hypothesis and the p-value...
 Question 22 3 pts Suppose you are interested in testing a null hypothesis and the p-value associated with the test statistic is 0.004. As a result, you should o reject the null hypothesis at the 5-percent level of significance, but not at the 1- percent level of significance. do not reject the null hypothesis at the 5-percent level of significance, but do reject the null at the 1-percent level of significance. o do not reject the null hypothesis at the...
1. To test whether or not there is a difference between treatments A, B, and C,...
1. To test whether or not there is a difference between treatments A, B, and C, a sample of 12 observations has been randomly assigned to the 3 treatments. You are given the results below. Treatment Observation A 20 30 25 33 B 22 26 20 28 C 40 30 28 22 The null hypothesis is to be tested at the 1% level of significance. The p-value is: 2. Question 12 Not yet answered Points out of 2.0 Remove flag...
1. A(n) _____________ is the distance between a score and the mean of the group of...
1. A(n) _____________ is the distance between a score and the mean of the group of scores. Variation ratio Standard deviation Dispersion Interquartile range Mean deviation score 2. The ___________ is a probability threshold or cutoff value used in hypothesis testing that signifies the level of risk we are willing to take in making a Type I error (i.e., false positive, or rejecting a true null hypothesis). binomial distribution conditional probability null hypothesis sampling distribution alpha level 3. Researchers commonly...
 A random sample of size n= 15 obtained from a population that is normally distributed results in a sample mean of 45.8 and sample standard deviation 12.2. An independent sample of size n = 20 obtained from a population that is normally distributed results in a sample mean of 51.9 and sample standard deviation 14.6. Does this constitute sufficient evidence to conclude that the population means differ at the a = 0.05 level of significance? Click here to view the...
 2. [25 POINTS = 15+101 BONNIE (WHO WORKS AS INSURANCE ANALYST) COLLECTED DATA FOR TWO INDEPENDENT GROUPS OF CAR POLICIES, EACH GROUPS INCLUDED n1 = n2 8 MONTHLY PREMIUM VALUES. BONNIE ASSUMED THAT THE POPULATION VARIANCES FOR TWO GROUPS ARE KNOWN AS (σ)-(o2)2 = 9 SAMPLE SUMMARIES WERE FOUND AS FOLLOWS (SAMPLE MEAN FOR GROUP I) = 33.40 AND (SAMPLE VARIANCE) = 7 (SAMPLE MEAN FOR GROUP II)-37.30 AND (SAMPLE VARIANCE)-11 AT THE 1% SIGNIFICANCE LEVEL, DOES BONNIE HAVE SUFFICIENT...
 i need 9 though 15 please and thank you
STAT 2480 Chapter 9: Significance Tests About Hypotheses Across 1. In a significance test, the null hypothesis is presumed to unless the data give strong evidence against it. Down 2. The hypothesis is usually a statement of no treatment effect the null hypothesis 3. A Type 1 Error is when we when it is true. 4. When the null hypothesis is rejected because the P- value is less than or equal...
i need 9 though 15 please and thank you
STAT 2480 Chapter 9: Significance Tests About Hypotheses Across 1. In a significance test, the null hypothesis is presumed to unless the data give strong evidence against it. Down 2. The hypothesis is usually a statement of no treatment effect the null hypothesis 3. A Type 1 Error is when we when it is true. 4. When the null hypothesis is rejected because the P- value is less than or equal...
 For a random sample of 36 data pairs, the sample mean of the differences was 0.72. The sample standard deviation of the differences was 2. At the 5% level of significance, test the claim that the population mean of the differences is different from 0. (a) Is it appropriate to use a Student's t distribution for the sample test statistic? Explain. No, the sample size is not larger than 30. Yes, the sample size is larger than 30. No, the...
 Question 22 3 pts Suppose you are interested in testing a null hypothesis and the p-value associated with the test statistic is 0.004. As a result, you should o reject the null hypothesis at the 5-percent level of significance, but not at the 1- percent level of significance. do not reject the null hypothesis at the 5-percent level of significance, but do reject the null at the 1-percent level of significance. o do not reject the null hypothesis at the...
Most questions answered within 3 hours.
-
Le Terroir Winery is considering an expansion project to produce
fine wines. The trial expansion will...
asked 9 seconds ago -
The Bahraini public budget experiences deficit in the last
seven years, what are procedures are taken...
asked 7 minutes ago -
You invested $30,000 in a mutual fund at the beginning of the
year when the NAV...
asked 10 minutes ago -
Would you expect the price elasticity of supply for guitars to
be more inelastic in the...
asked 12 minutes ago -
A snowmobile is originally at the point with position vector
30.1 m at 95.0° counterclockwise from...
asked 12 minutes ago -
MAN3240 Organizational Behavior
In one to two paragraphs
6.) How can understanding emotions make me more...
asked 20 minutes ago -
Identify one individual who, in your opinion, is an excellent
leader. List the qualities that this...
asked 18 minutes ago -
For the data set shown below, complete parts (a) through (d)
below. x 3 4 5...
asked 24 minutes ago -
A university administrator working in student housing wants to
determine if the percentage of students residing...
asked 38 minutes ago -
3). Describe human population growth that has occurred in the
past 400 years. Use terms learned...
asked 35 minutes ago -
A
projectile is blue at a target. The distance from the point of
impact to the...
asked 59 minutes ago -
Given a 32 bit processor, with 2 MB of physical RAM split into 512
frames. What...
asked 49 minutes ago