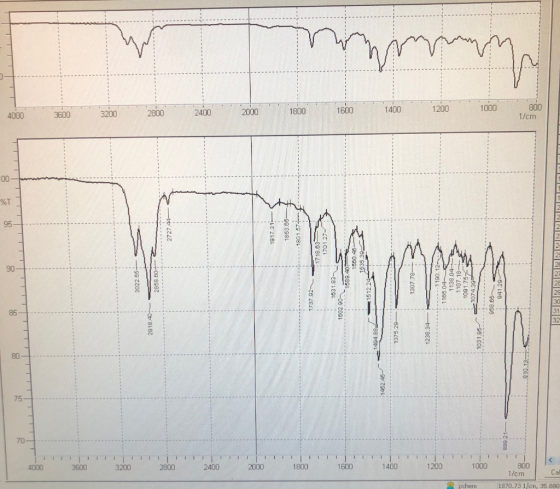
I performed a Friedel-Crafts acylation with toluene and benzoyl chloride as the reactants and aluminum chloride as the catalyst. The product was expected to be a mixture of para- and ortho-isomers of methylbenzophenone. This is the IR spectrum of the product that I obtained. I am trying to figure out if I obtained methylbenzophenone based on this spectrum. Please be detailed as to why it is or is not methylbenzophenone and if not, what else it could be! Thanks!
Homework Answers
IR Spectrum is a useful tool to predict the formation of a new bond.
The usual observed vibrational frequency of C=O is 1725-1700 cm-1 and that of C- Cl bond is around 700 cm-1. But the peak of the C-Cl bond is missing in the spectrum.
Since a peak appears around 1737.97 cm-1, we can assume the formation of a product, i.e, C=O frequency may have shifted from 1725-1700 cm-1 to 1737-97 cm-1. In order to confirm the formation of the product, you have to check the IR Spectrum of Benzoyl chloride and compare the C=O frequency with the product to know the shift in frequency.
If the product is not formed it may be the IR of the starting material Benzoyl chloride.
Add Answer to:
I performed a Friedel-Crafts acylation with toluene and benzoyl
chloride as the reactants and aluminum chloride...
2. The following IR spectra each include the structure of the corresponding compound directly on the...
 2. The following IR spectra each include the structure of the corresponding compound directly on the spectrum (continued on following pages). • Based on the given structures and the information provided in Tables 8.1 and 8.2, assign as many of the major absorptions as possible directly on the spectra o indicating what type of bond O and whether it corresponds to bending or a stretching vibration. Transmittance (%) 0 + 4000 3600 3200 2000 2400 1400 1200 1000 800 600...
IR Worksheet-CHEM 2460 Spectrum A- Fare the IR spectra of the compounds shown, In Spectrum A-F,...
 IR Worksheet-CHEM 2460 Spectrum A- Fare the IR spectra of the compounds shown, In Spectrum A-F, assign the major absorptions above 1500 em in the spectrum of each compound, (using and 8 2 [see background informationD) A. IR spectra of phenylethyne 100 80 40 20- 4000 3600 3200 2800 2400 2000 1800 1600 1400 1200 1000800 Wavenumber (cm) IR spectra of n-butyl acetate 100 B. 80 60 40 CHsCO(CH2)30% 20 4000 3600 3200 2800 2400 2000 1800 1600 1400 1200...
Spectrum A - Fare the IR spectra of the compounds showna. In Spectrum A -F. assign...
 Spectrum A - Fare the IR spectra of the compounds showna. In Spectrum A -F. assign the major absorptions above .-1500 cm. in the spectrum of each compo and, (using Tables and 8 2 Isee background information). section C. IR spectra of N.N-dimethylacetamide 100 60 40 CH CN(CHsh 20 0-T 4000 3000 3200 2000 2400 2000 1 1600 1400 1200罒… Waverumtor (cmr*) D. IR spectra of diethyl ether (Also assign the peak at 1 1 10 cm-1) 100 80 60...
read the IR spectroscopy with detail please 119 100 %Transmittance 204 10 1600 1400 1200 1000000...
 read the IR spectroscopy with detail please
119 100 %Transmittance 204 10 1600 1400 1200 1000000 600 3800 3600 3400 2400 2200 2000 1800 Wavenumbers (cm-1) 3000 2600 2600 3200 unknown % Transmittance 000 1200 1000 000 1600 1400 1800 2600 2800 3000 3200 2400 2200 2000 Wavenumbers (cm-1) 3600 3600 3400 We were unable to transcribe this image
read the IR spectroscopy with detail please
119 100 %Transmittance 204 10 1600 1400 1200 1000000 600 3800 3600 3400 2400 2200 2000 1800 Wavenumbers (cm-1) 3000 2600 2600 3200 unknown % Transmittance 000 1200 1000 000 1600 1400 1800 2600 2800 3000 3200 2400 2200 2000 Wavenumbers (cm-1) 3600 3600 3400 We were unable to transcribe this image
Describe the following peaks by giving either the range of the absorbance in wavenumbers (for bro...
 Describe the following peaks by giving either the range of the absorbance in wavenumbers (for broad peaks) or the location of the centre of the absorbance (for narrower peaks). Identify what the absorbances could be based upon the regions A-F. Determine, to the best of your ability, the structure of the compound, and highlight the options from the interpretation that support your decision. The mass of the compound is 88.11 amu. 4000 3600 3200 2800 2400 2000 1800 1600 1400...
8) Propose a structure for the following compound based on its molecular formula (C4H2O2) and its...
 8) Propose a structure for the following compound based on its molecular formula (C4H2O2) and its IR spectrum 25 2.6 2.7 2.8 2.9 3.5 4 45 9 10 11 12 13 14 15 16 4000 3800 36000 3400 3200 3000 2800 2600 2400 2200 2000 1400 1200 1000 1800 1600 Wavenumber(cm) 9) Propose a structure for the following compound based on its molecular formula (C6H120) and its IR spectrum wavelength (um) 25 26 2.7 2.8 2. 9 3 5 4...
Identify and Label all functional groups in the graph. Conduct an IR analysis. 80.0 70.0 60.0...
 Identify and Label all functional groups in the graph. Conduct
an IR analysis.
80.0 70.0 60.0 50.0 40.0 30.0 20.0 10.0 an ” 3800 3600 3400 3200 3000 2800 2600 2400 2200 2000 1800 1600 1400 1200 1000 800 Wavenumbers (cm-1
Identify and Label all functional groups in the graph. Conduct
an IR analysis.
80.0 70.0 60.0 50.0 40.0 30.0 20.0 10.0 an ” 3800 3600 3400 3200 3000 2800 2600 2400 2200 2000 1800 1600 1400 1200 1000 800 Wavenumbers (cm-1
label the IR with the bonds. MW 3600 3200 2800 2400 2000 1800 1600 1400 1200...
 label the IR with the bonds.
MW 3600 3200 2800 2400 2000 1800 1600 1400 1200 cm-1
label the IR with the bonds.
MW 3600 3200 2800 2400 2000 1800 1600 1400 1200 cm-1
Determine the structure of the compounds using the specteral infromation shown below. s compound has the...
 Determine the structure of the compounds using the specteral
infromation shown below.
s compound has the molecular formula C4H1N MICRONS 14 15 16 90 70 50 30 20 4000 3600 3200 2 2800 2400 1000 800 600 1600 WAVENUMBERS (CM-1) 1800 1400 1200 quartet 10
Determine the structure of the compounds using the specteral
infromation shown below.
s compound has the molecular formula C4H1N MICRONS 14 15 16 90 70 50 30 20 4000 3600 3200 2 2800 2400 1000 800 600 1600 WAVENUMBERS (CM-1) 1800 1400 1200 quartet 10
Compound A displays the following MS, 'HNMR, and IR spectra. Compound A decolorizes a solution of...
 q
is for quadruplet and t is for triplet
Compound A displays the following MS, 'HNMR, and IR spectra. Compound A decolorizes a solution of bromine in dichloromethane. Suggest a structure for Compound A consistent with all of the data given. Account for all of the numbered peaks in the MS, interpret each NMR signal, and identify each peak in the functional group region of the IR spectrum. 4. 100 80 20 10 30 50 60 70 100 A !...
q
is for quadruplet and t is for triplet
Compound A displays the following MS, 'HNMR, and IR spectra. Compound A decolorizes a solution of bromine in dichloromethane. Suggest a structure for Compound A consistent with all of the data given. Account for all of the numbered peaks in the MS, interpret each NMR signal, and identify each peak in the functional group region of the IR spectrum. 4. 100 80 20 10 30 50 60 70 100 A !...
 2. The following IR spectra each include the structure of the corresponding compound directly on the spectrum (continued on following pages). • Based on the given structures and the information provided in Tables 8.1 and 8.2, assign as many of the major absorptions as possible directly on the spectra o indicating what type of bond O and whether it corresponds to bending or a stretching vibration. Transmittance (%) 0 + 4000 3600 3200 2000 2400 1400 1200 1000 800 600...
 IR Worksheet-CHEM 2460 Spectrum A- Fare the IR spectra of the compounds shown, In Spectrum A-F, assign the major absorptions above 1500 em in the spectrum of each compound, (using and 8 2 [see background informationD) A. IR spectra of phenylethyne 100 80 40 20- 4000 3600 3200 2800 2400 2000 1800 1600 1400 1200 1000800 Wavenumber (cm) IR spectra of n-butyl acetate 100 B. 80 60 40 CHsCO(CH2)30% 20 4000 3600 3200 2800 2400 2000 1800 1600 1400 1200...
 Spectrum A - Fare the IR spectra of the compounds showna. In Spectrum A -F. assign the major absorptions above .-1500 cm. in the spectrum of each compo and, (using Tables and 8 2 Isee background information). section C. IR spectra of N.N-dimethylacetamide 100 60 40 CH CN(CHsh 20 0-T 4000 3000 3200 2000 2400 2000 1 1600 1400 1200罒… Waverumtor (cmr*) D. IR spectra of diethyl ether (Also assign the peak at 1 1 10 cm-1) 100 80 60...
 read the IR spectroscopy with detail please
119 100 %Transmittance 204 10 1600 1400 1200 1000000 600 3800 3600 3400 2400 2200 2000 1800 Wavenumbers (cm-1) 3000 2600 2600 3200 unknown % Transmittance 000 1200 1000 000 1600 1400 1800 2600 2800 3000 3200 2400 2200 2000 Wavenumbers (cm-1) 3600 3600 3400 We were unable to transcribe this image
read the IR spectroscopy with detail please
119 100 %Transmittance 204 10 1600 1400 1200 1000000 600 3800 3600 3400 2400 2200 2000 1800 Wavenumbers (cm-1) 3000 2600 2600 3200 unknown % Transmittance 000 1200 1000 000 1600 1400 1800 2600 2800 3000 3200 2400 2200 2000 Wavenumbers (cm-1) 3600 3600 3400 We were unable to transcribe this image
 Describe the following peaks by giving either the range of the absorbance in wavenumbers (for broad peaks) or the location of the centre of the absorbance (for narrower peaks). Identify what the absorbances could be based upon the regions A-F. Determine, to the best of your ability, the structure of the compound, and highlight the options from the interpretation that support your decision. The mass of the compound is 88.11 amu. 4000 3600 3200 2800 2400 2000 1800 1600 1400...
 8) Propose a structure for the following compound based on its molecular formula (C4H2O2) and its IR spectrum 25 2.6 2.7 2.8 2.9 3.5 4 45 9 10 11 12 13 14 15 16 4000 3800 36000 3400 3200 3000 2800 2600 2400 2200 2000 1400 1200 1000 1800 1600 Wavenumber(cm) 9) Propose a structure for the following compound based on its molecular formula (C6H120) and its IR spectrum wavelength (um) 25 26 2.7 2.8 2. 9 3 5 4...
 Identify and Label all functional groups in the graph. Conduct
an IR analysis.
80.0 70.0 60.0 50.0 40.0 30.0 20.0 10.0 an ” 3800 3600 3400 3200 3000 2800 2600 2400 2200 2000 1800 1600 1400 1200 1000 800 Wavenumbers (cm-1
Identify and Label all functional groups in the graph. Conduct
an IR analysis.
80.0 70.0 60.0 50.0 40.0 30.0 20.0 10.0 an ” 3800 3600 3400 3200 3000 2800 2600 2400 2200 2000 1800 1600 1400 1200 1000 800 Wavenumbers (cm-1
 label the IR with the bonds.
MW 3600 3200 2800 2400 2000 1800 1600 1400 1200 cm-1
label the IR with the bonds.
MW 3600 3200 2800 2400 2000 1800 1600 1400 1200 cm-1
 Determine the structure of the compounds using the specteral
infromation shown below.
s compound has the molecular formula C4H1N MICRONS 14 15 16 90 70 50 30 20 4000 3600 3200 2 2800 2400 1000 800 600 1600 WAVENUMBERS (CM-1) 1800 1400 1200 quartet 10
Determine the structure of the compounds using the specteral
infromation shown below.
s compound has the molecular formula C4H1N MICRONS 14 15 16 90 70 50 30 20 4000 3600 3200 2 2800 2400 1000 800 600 1600 WAVENUMBERS (CM-1) 1800 1400 1200 quartet 10
 q
is for quadruplet and t is for triplet
Compound A displays the following MS, 'HNMR, and IR spectra. Compound A decolorizes a solution of bromine in dichloromethane. Suggest a structure for Compound A consistent with all of the data given. Account for all of the numbered peaks in the MS, interpret each NMR signal, and identify each peak in the functional group region of the IR spectrum. 4. 100 80 20 10 30 50 60 70 100 A !...
q
is for quadruplet and t is for triplet
Compound A displays the following MS, 'HNMR, and IR spectra. Compound A decolorizes a solution of bromine in dichloromethane. Suggest a structure for Compound A consistent with all of the data given. Account for all of the numbered peaks in the MS, interpret each NMR signal, and identify each peak in the functional group region of the IR spectrum. 4. 100 80 20 10 30 50 60 70 100 A !...
Most questions answered within 3 hours.
-
Suppose N packets are sent,
and each packet arrives at rate of L/2R to a link....
asked 11 minutes ago -
17. Show the steps involved in reduction of the ketone in fatty
acid synthesis. Which cofactor...
asked 13 minutes ago -
5.61 g of octane, C8H18, reacts with excess oxygen in a bomb
calorimeter. The heat capacity...
asked 17 minutes ago -
The velocity field of a flow is given by V = (2+1) x
y2 i +...
asked 26 minutes ago -
(EPS with
Convertible Bonds) On June 1, 2012, Bluhm Company and
Amanar Company merged to form...
asked 23 minutes ago -
2. Discuss why the study exemplifies one that agrees with The
American Psychological Association’s (APA) Ethical...
asked 27 minutes ago -
Without considering the following capital gains and losses,
Charlene, who is single, has a taxable income...
asked 34 minutes ago -
1a. The __________ functional group often triggers our sense of
smell.
1b. The geometry around a...
asked 48 minutes ago -
A uniform plank of length 2.00 m and mass 34.0 kg is supported
by three ropes,...
asked 48 minutes ago -
Suppose a floor on a hospital has 12 physicians at any given
time. You are brought...
asked 1 hour ago -
Compartmentalization
in eukaryotic cells facilitates chemical reactions happening faster
due to... Select all
Substrates needed for...
asked 49 minutes ago -
The deltaH for the solution process when solid sodium
hydroxide dissolves in water is 44.4 kJ/mol....
asked 52 minutes ago