

Homework Answers
Ist spectra from TOP
the band at around 3300 cm-1 is due to the hydroxy group
the band between 2850 - 2950 cm-1 is due to aliphatic CH stretching
based on the above analysis the structure of the compound must be aliphatic alcohol
IInd spectra from TOP
the band at around 2850 - 2950 cm-1 is due to aliphatic CH stretching
the band at around 1700 cm-1 is due to the carbonyl group
the band at around 1200 cm-1 is due to C-O stretching
based on the above analysis the structure of the compound must be ester
IIIrd spectra from top
the strong band at around 3025 cm-1 is due to aromatic CH stretching
the band at around 2850 - 2950 cm-1 is due to aliphatic CH stretching
the band at around 1450 cm-1 might be due to aromatic C=C stretching
therefore compound must be an aromatic compound
Add Answer to:
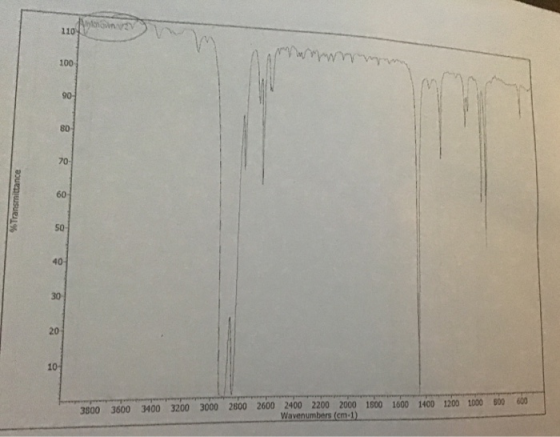
read the IR spectroscopy with detail please
119 100 %Transmittance 204 10 1600 1400 1200 1000000...
Identify and Label all functional groups in the graph. Conduct an IR analysis. 80.0 70.0 60.0...
 Identify and Label all functional groups in the graph. Conduct
an IR analysis.
80.0 70.0 60.0 50.0 40.0 30.0 20.0 10.0 an ” 3800 3600 3400 3200 3000 2800 2600 2400 2200 2000 1800 1600 1400 1200 1000 800 Wavenumbers (cm-1
Identify and Label all functional groups in the graph. Conduct
an IR analysis.
80.0 70.0 60.0 50.0 40.0 30.0 20.0 10.0 an ” 3800 3600 3400 3200 3000 2800 2600 2400 2200 2000 1800 1600 1400 1200 1000 800 Wavenumbers (cm-1
2. The following IR spectra each include the structure of the corresponding compound directly on the...
 2. The following IR spectra each include the structure of the corresponding compound directly on the spectrum (continued on following pages). • Based on the given structures and the information provided in Tables 8.1 and 8.2, assign as many of the major absorptions as possible directly on the spectra o indicating what type of bond O and whether it corresponds to bending or a stretching vibration. Transmittance (%) 0 + 4000 3600 3200 2000 2400 1400 1200 1000 800 600...
Can you please help me identify the unknown polymer using the provided IR spectra. Possible polymer choices include: (1)...
 Can you please help me identify the
unknown polymer using the provided IR spectra. Possible polymer
choices include: (1) Polyethylene; (2) Polyvinyl Chloride; (3)
Polycarbonate; (4) Polystyrene; (5) Polyacrylamide. Thank
you!
Tue Nov 05 10:32:29 2019 (GMT-05:00) 1794.08 516.16 1018.81 875.27 % Transmittance 730.23719.48 1462.71 2926.202 2849.83 -15 4000 3800 3600 3400 3200 3000 2800 2600 2400 2000 1800 1600 1400 1200 1 000 8 00 600 2200 Wavenumbers (cm-1)
Can you please help me identify the
unknown polymer using the provided IR spectra. Possible polymer
choices include: (1) Polyethylene; (2) Polyvinyl Chloride; (3)
Polycarbonate; (4) Polystyrene; (5) Polyacrylamide. Thank
you!
Tue Nov 05 10:32:29 2019 (GMT-05:00) 1794.08 516.16 1018.81 875.27 % Transmittance 730.23719.48 1462.71 2926.202 2849.83 -15 4000 3800 3600 3400 3200 3000 2800 2600 2400 2000 1800 1600 1400 1200 1 000 8 00 600 2200 Wavenumbers (cm-1)
8) Propose a structure for the following compound based on its molecular formula (C4H2O2) and its...
 8) Propose a structure for the following compound based on its molecular formula (C4H2O2) and its IR spectrum 25 2.6 2.7 2.8 2.9 3.5 4 45 9 10 11 12 13 14 15 16 4000 3800 36000 3400 3200 3000 2800 2600 2400 2200 2000 1400 1200 1000 1800 1600 Wavenumber(cm) 9) Propose a structure for the following compound based on its molecular formula (C6H120) and its IR spectrum wavelength (um) 25 26 2.7 2.8 2. 9 3 5 4...
Draw the expected IR for the following two molecules. Label each peak by functional group нал...
 Draw the expected IR for the following two molecules. Label each peak by functional group нал 3800 3600 3400 3200 3000 2800 2200 1800 1600 1400 1200 1000 3800 3600 3400 3200 3000 2800 2200 1800 1600 1400 1200 1000
What are the functional groups present in this IR and where are they locate d Varian...
 What are the functional groups present in this IR and where are
they locate
d
Varian Resolutions G918(2 99- 98 97- 96 95 94 3800 3600 3400 3200 3000 2800 2600 2400 2200 2000 1800 1600 1400 1200 1000 Wavenumber Name Spectrum HitistComment APBKG918(2]
What are the functional groups present in this IR and where are
they locate
d
Varian Resolutions G918(2 99- 98 97- 96 95 94 3800 3600 3400 3200 3000 2800 2600 2400 2200 2000 1800 1600 1400 1200 1000 Wavenumber Name Spectrum HitistComment APBKG918(2]
For IR spectroscopy assigning peaks, could you please explain to me how do we tell which structur...
 For
IR spectroscopy assigning peaks, could you please explain to me how
do we tell which structure belong to each regions of peaks.
or C -H 000 3800 30 3400 3200 3000 2800 2000 2400 2200 C-H stretch of ep Alkene 2 9 10 5 26 2.7 28 293 2000 4000 3800 3600 3400 3200 3000 2800 2600 2400 2200 Alkene 3 0r 26 27 28 29 3 NICOLET sx 4000 soo 3500 300 3200 3000 2to0 2000 N 0...
For
IR spectroscopy assigning peaks, could you please explain to me how
do we tell which structure belong to each regions of peaks.
or C -H 000 3800 30 3400 3200 3000 2800 2000 2400 2200 C-H stretch of ep Alkene 2 9 10 5 26 2.7 28 293 2000 4000 3800 3600 3400 3200 3000 2800 2600 2400 2200 Alkene 3 0r 26 27 28 29 3 NICOLET sx 4000 soo 3500 300 3200 3000 2to0 2000 N 0...
Can you please help me identify the unknown polymer using the provided IR spectra. Possible polymer...
 Can you please help me identify the unknown
polymer using the provided IR spectra. Possible polymer choices
include: (1) Polyethylene; (2) Polyvinyl Chloride; (3)
Polycarbonate; (4) Polystyrene; (5) Polyacrylamide. Thank
you!
% Transmittance 4000 3800 Tue Nov 05 10:37:13 2019 (GMT-05:00) 3600 3400 3200 3081.83 3059.69) 3000 3025.67 3001.08 2923.44 2849.31 2800 2600 2400 Wavenumbers (cm-1) 2200 2000 1942.69 1870.07 1800 1802.04 1746.69 1667.47 1600 1601.14 1582.98 1540.77K 1492.88 1452.28 1400 1372.08 1328.40 1200 1181.31 1154.47 1069.17 1 000 1028.36...
Can you please help me identify the unknown
polymer using the provided IR spectra. Possible polymer choices
include: (1) Polyethylene; (2) Polyvinyl Chloride; (3)
Polycarbonate; (4) Polystyrene; (5) Polyacrylamide. Thank
you!
% Transmittance 4000 3800 Tue Nov 05 10:37:13 2019 (GMT-05:00) 3600 3400 3200 3081.83 3059.69) 3000 3025.67 3001.08 2923.44 2849.31 2800 2600 2400 Wavenumbers (cm-1) 2200 2000 1942.69 1870.07 1800 1802.04 1746.69 1667.47 1600 1601.14 1582.98 1540.77K 1492.88 1452.28 1400 1372.08 1328.40 1200 1181.31 1154.47 1069.17 1 000 1028.36...
One of the following compounds is responsible for the IR spectrum shown. Choose the structure of...
 One of the following compounds is responsible for the IR spectrum shown. Choose the structure of the responsible compound. Transmittance 4000 3800 3600 3400 3200 3000 2800 2600 2400 2200 1200 1000 1800 1600 Wavenumber om CH,OH о нон or Submit Previous Answers Request Answer
Draw the expected IR for the following two molecules. Label each peak by functional group (2.5...
 Draw the expected IR for the following two molecules. Label each peak by functional group (2.5 points per spectra, 1.5 point for drawing spectra and, 1 point for labeling each peak) NH 3800 3600 3400 3200 3000 2800 2200 1800 1600 1400 1200 1000 3800 3600 3400 3200 3000 2800 2200 1800 1600 1400 1200 1000
 Identify and Label all functional groups in the graph. Conduct
an IR analysis.
80.0 70.0 60.0 50.0 40.0 30.0 20.0 10.0 an ” 3800 3600 3400 3200 3000 2800 2600 2400 2200 2000 1800 1600 1400 1200 1000 800 Wavenumbers (cm-1
Identify and Label all functional groups in the graph. Conduct
an IR analysis.
80.0 70.0 60.0 50.0 40.0 30.0 20.0 10.0 an ” 3800 3600 3400 3200 3000 2800 2600 2400 2200 2000 1800 1600 1400 1200 1000 800 Wavenumbers (cm-1
 2. The following IR spectra each include the structure of the corresponding compound directly on the spectrum (continued on following pages). • Based on the given structures and the information provided in Tables 8.1 and 8.2, assign as many of the major absorptions as possible directly on the spectra o indicating what type of bond O and whether it corresponds to bending or a stretching vibration. Transmittance (%) 0 + 4000 3600 3200 2000 2400 1400 1200 1000 800 600...
 Can you please help me identify the
unknown polymer using the provided IR spectra. Possible polymer
choices include: (1) Polyethylene; (2) Polyvinyl Chloride; (3)
Polycarbonate; (4) Polystyrene; (5) Polyacrylamide. Thank
you!
Tue Nov 05 10:32:29 2019 (GMT-05:00) 1794.08 516.16 1018.81 875.27 % Transmittance 730.23719.48 1462.71 2926.202 2849.83 -15 4000 3800 3600 3400 3200 3000 2800 2600 2400 2000 1800 1600 1400 1200 1 000 8 00 600 2200 Wavenumbers (cm-1)
Can you please help me identify the
unknown polymer using the provided IR spectra. Possible polymer
choices include: (1) Polyethylene; (2) Polyvinyl Chloride; (3)
Polycarbonate; (4) Polystyrene; (5) Polyacrylamide. Thank
you!
Tue Nov 05 10:32:29 2019 (GMT-05:00) 1794.08 516.16 1018.81 875.27 % Transmittance 730.23719.48 1462.71 2926.202 2849.83 -15 4000 3800 3600 3400 3200 3000 2800 2600 2400 2000 1800 1600 1400 1200 1 000 8 00 600 2200 Wavenumbers (cm-1)
 8) Propose a structure for the following compound based on its molecular formula (C4H2O2) and its IR spectrum 25 2.6 2.7 2.8 2.9 3.5 4 45 9 10 11 12 13 14 15 16 4000 3800 36000 3400 3200 3000 2800 2600 2400 2200 2000 1400 1200 1000 1800 1600 Wavenumber(cm) 9) Propose a structure for the following compound based on its molecular formula (C6H120) and its IR spectrum wavelength (um) 25 26 2.7 2.8 2. 9 3 5 4...
 Draw the expected IR for the following two molecules. Label each peak by functional group нал 3800 3600 3400 3200 3000 2800 2200 1800 1600 1400 1200 1000 3800 3600 3400 3200 3000 2800 2200 1800 1600 1400 1200 1000
 What are the functional groups present in this IR and where are
they locate
d
Varian Resolutions G918(2 99- 98 97- 96 95 94 3800 3600 3400 3200 3000 2800 2600 2400 2200 2000 1800 1600 1400 1200 1000 Wavenumber Name Spectrum HitistComment APBKG918(2]
What are the functional groups present in this IR and where are
they locate
d
Varian Resolutions G918(2 99- 98 97- 96 95 94 3800 3600 3400 3200 3000 2800 2600 2400 2200 2000 1800 1600 1400 1200 1000 Wavenumber Name Spectrum HitistComment APBKG918(2]
 For
IR spectroscopy assigning peaks, could you please explain to me how
do we tell which structure belong to each regions of peaks.
or C -H 000 3800 30 3400 3200 3000 2800 2000 2400 2200 C-H stretch of ep Alkene 2 9 10 5 26 2.7 28 293 2000 4000 3800 3600 3400 3200 3000 2800 2600 2400 2200 Alkene 3 0r 26 27 28 29 3 NICOLET sx 4000 soo 3500 300 3200 3000 2to0 2000 N 0...
For
IR spectroscopy assigning peaks, could you please explain to me how
do we tell which structure belong to each regions of peaks.
or C -H 000 3800 30 3400 3200 3000 2800 2000 2400 2200 C-H stretch of ep Alkene 2 9 10 5 26 2.7 28 293 2000 4000 3800 3600 3400 3200 3000 2800 2600 2400 2200 Alkene 3 0r 26 27 28 29 3 NICOLET sx 4000 soo 3500 300 3200 3000 2to0 2000 N 0...
 Can you please help me identify the unknown
polymer using the provided IR spectra. Possible polymer choices
include: (1) Polyethylene; (2) Polyvinyl Chloride; (3)
Polycarbonate; (4) Polystyrene; (5) Polyacrylamide. Thank
you!
% Transmittance 4000 3800 Tue Nov 05 10:37:13 2019 (GMT-05:00) 3600 3400 3200 3081.83 3059.69) 3000 3025.67 3001.08 2923.44 2849.31 2800 2600 2400 Wavenumbers (cm-1) 2200 2000 1942.69 1870.07 1800 1802.04 1746.69 1667.47 1600 1601.14 1582.98 1540.77K 1492.88 1452.28 1400 1372.08 1328.40 1200 1181.31 1154.47 1069.17 1 000 1028.36...
Can you please help me identify the unknown
polymer using the provided IR spectra. Possible polymer choices
include: (1) Polyethylene; (2) Polyvinyl Chloride; (3)
Polycarbonate; (4) Polystyrene; (5) Polyacrylamide. Thank
you!
% Transmittance 4000 3800 Tue Nov 05 10:37:13 2019 (GMT-05:00) 3600 3400 3200 3081.83 3059.69) 3000 3025.67 3001.08 2923.44 2849.31 2800 2600 2400 Wavenumbers (cm-1) 2200 2000 1942.69 1870.07 1800 1802.04 1746.69 1667.47 1600 1601.14 1582.98 1540.77K 1492.88 1452.28 1400 1372.08 1328.40 1200 1181.31 1154.47 1069.17 1 000 1028.36...
 One of the following compounds is responsible for the IR spectrum shown. Choose the structure of the responsible compound. Transmittance 4000 3800 3600 3400 3200 3000 2800 2600 2400 2200 1200 1000 1800 1600 Wavenumber om CH,OH о нон or Submit Previous Answers Request Answer
 Draw the expected IR for the following two molecules. Label each peak by functional group (2.5 points per spectra, 1.5 point for drawing spectra and, 1 point for labeling each peak) NH 3800 3600 3400 3200 3000 2800 2200 1800 1600 1400 1200 1000 3800 3600 3400 3200 3000 2800 2200 1800 1600 1400 1200 1000
Most questions answered within 3 hours.
-
Although Epicurus advocates pursuing pleasure for the
good life, discuss a few reasons why he does...
asked 8 minutes ago -
Problem 1: Present entries to record the selected transactions
described below:
(a)
Issued $2,790,000 of 5-year,...
asked 14 minutes ago -
Using technology to support HR activities increases:
a.
the efficiency of the administrative HR functions.
b....
asked 15 minutes ago -
1. List the features used to classify leaf
types.
2. List some characteristics that are shared...
asked 20 minutes ago -
The three elements of Value Proposition, Key Customers, and
Capabilities operate within an environment. Which of...
asked 23 minutes ago -
Katelynn, a physician, earns $200,000 from her medical practice
in the current year. She receives $45,000...
asked 30 minutes ago -
Each row of the table below describes an aqueous solution at
25°C
.
The second column...
asked 34 minutes ago -
A horizontal wire is at y = 0. Current travels in the +x
direction. The magnetic...
asked 35 minutes ago -
Let X be a continuous random variable whose PDF is Let X be a
continuous random...
asked 56 minutes ago -
Martinez Company’s relevant range of production is 7,500 units
to 12,500 units. When it produces and...
asked 54 minutes ago -
A football with a mass of 1.2 kg is kicked from ground level to
a height...
asked 1 hour ago -
Remember: Changes in supply determinants shift supply, and
changes in demand determinants shift demand. We say...
asked 58 minutes ago