
Homework Answers
Please ask, if you have any doubts through the comment section. Do rate the answer
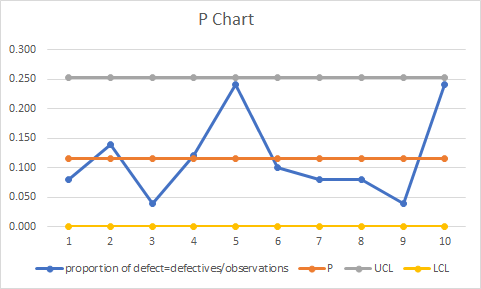
Answer: P chart will be used to monitor the proportion of defects in given sample
Answer a: 99.73% control limits corresponds to 3 sigma limits
UCLp= 0.252
LCLp= 0.000
Yes, The process is in control: As we can see that NO sample is beyond control limits in charts
Explanation:
| Day | Defectives | Observations |
| 1 | 4 | 50 |
| 2 | 7 | 50 |
| 3 | 2 | 50 |
| 4 | 6 | 50 |
| 5 | 12 | 50 |
| 6 | 5 | 50 |
| 7 | 4 | 50 |
| 8 | 4 | 50 |
| 9 | 2 | 50 |
| 10 | 12 | 50 |
| total | 58 | 500 |
| steps and formulas, for z=3 | ||
| Proportion of defects=Pbar | total defectives/total observations | 0.116 |
| Q= | 1-P | 0.884 |
| N= | average sample size | 50 |
| Standard deviation | squareroot(P*Q/N) | 0.045 |
| UCL= | P + z*squareroot(P*Q/N) | 0.252 |
| LCL= | P - z*squareroot(P*Q/N) | -0.020 |
| defects cannot be negative, therefore negative LCL is taken as '0' | 0.000 |
Use the table below for the chart
| Day | Defectives | Observations | proportion of defect=defectives/observations | P | UCL | LCL |
| 1 | 4 | 50 | 0.080 | 0.116 | 0.252 | 0.000 |
| 2 | 7 | 50 | 0.140 | 0.116 | 0.252 | 0.000 |
| 3 | 2 | 50 | 0.040 | 0.116 | 0.252 | 0.000 |
| 4 | 6 | 50 | 0.120 | 0.116 | 0.252 | 0.000 |
| 5 | 12 | 50 | 0.240 | 0.116 | 0.252 | 0.000 |
| 6 | 5 | 50 | 0.100 | 0.116 | 0.252 | 0.000 |
| 7 | 4 | 50 | 0.080 | 0.116 | 0.252 | 0.000 |
| 8 | 4 | 50 | 0.080 | 0.116 | 0.252 | 0.000 |
| 9 | 2 | 50 | 0.040 | 0.116 | 0.252 | 0.000 |
| 10 | 12 | 50 | 0.240 | 0.116 | 0.252 | 0.000 |
Answer b: if sample size is 25
UCLp= 0.485
LCLp= 0.000
Yes, The process is in control: As we can see that NO sample is beyond control limits in charts
Explanation:
| Day | Defectives | Observations |
| 1 | 4 | 25 |
| 2 | 7 | 25 |
| 3 | 2 | 25 |
| 4 | 6 | 25 |
| 5 | 12 | 25 |
| 6 | 5 | 25 |
| 7 | 4 | 25 |
| 8 | 4 | 25 |
| 9 | 2 | 25 |
| 10 | 12 | 25 |
| total | 58 | 250 |
| steps and formulas, for z=3 | ||
| Proportion of defects=Pbar | total defectives/total observations | 0.232 |
| Q= | 1-P | 0.768 |
| N= | average sample size | 25 |
| Standard deviation | squareroot(P*Q/N) | 0.084 |
| UCL= | P + z*squareroot(P*Q/N) | 0.485 |
| LCL= | P - z*squareroot(P*Q/N) | -0.021 |
| defects cannot be negative, therefore negative LCL is taken as '0' | 0.000 |
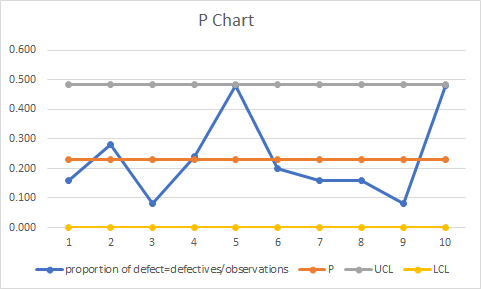
| Day | Defectives | Observations | proportion of defect=defectives/observations | P | UCL | LCL |
| 1 | 4 | 25 | 0.160 | 0.232 | 0.485 | 0.000 |
| 2 | 7 | 25 | 0.280 | 0.232 | 0.485 | 0.000 |
| 3 | 2 | 25 | 0.080 | 0.232 | 0.485 | 0.000 |
| 4 | 6 | 25 | 0.240 | 0.232 | 0.485 | 0.000 |
| 5 | 12 | 25 | 0.480 | 0.232 | 0.485 | 0.000 |
| 6 | 5 | 25 | 0.200 | 0.232 | 0.485 | 0.000 |
| 7 | 4 | 25 | 0.160 | 0.232 | 0.485 | 0.000 |
| 8 | 4 | 25 | 0.160 | 0.232 | 0.485 | 0.000 |
| 9 | 2 | 25 | 0.080 | 0.232 | 0.485 | 0.000 |
| 10 | 12 | 25 | 0.480 | 0.232 | 0.485 | 0.000 |
Add Answer to:
Jamison Kovach Supply Company manufactures paper clips and other office products. Although inexpensive, paper clips have...
Jamison Kovach Supply Company manufactures paper clips and other office products. Although? inexpensive, paper clips have...
Jamison Kovach Supply Company manufactures paper clips and other office products. Although? inexpensive, paper clips have provided the firm with a high margin of profitability. Sample size is 50. Results are given for the last 10 samples. Sample 1 2 3 4 5 6 7 8 9 10 Defectives 5 7 3 6 12 5 5 4 2 12 The type of control chart that is best to monitor this process is________ a)Establish the control limits to include? 99.73% of the random variation in defectives. UCLp= ______ (enteryour response as a number between 0 and? 1,rounded to three decimal? places)....
5. Metropolis Supply Company manufactures paper clips and other office products. Although inexpensive, paper clips have...
 5. Metropolis Supply Company manufactures paper clips and other office products. Although inexpensive, paper clips have provided the firm with a high margin of profitability. So, it is important to monitor closely the number of clips produced that are bad and cannot be sold. Samples of size 200 are selected each day and the number of bad clips is determined, below are the results for the last 10 samples (remember each sample is 200 paper clips): 1 1 2 3...
Must have hand calculations. Thank you. S6.20Jamison Kovach Supply Company manufactures paper clips and other office...
 Must have hand calculations. Thank you.
S6.20Jamison Kovach Supply Company manufactures paper clips and other office products. Although inexpen- sive, paper clips have provided the firm with a high margin of profitability. Sample size is 200. Results are given for the last 10 samples: SAMPLE 12 3 45678 9 10 DEFECTIVES a) Establish upper and lower control limits for the control chart and graph the data. b) Has the process been in control? c) If the sample size were 100...
Must have hand calculations. Thank you.
S6.20Jamison Kovach Supply Company manufactures paper clips and other office products. Although inexpen- sive, paper clips have provided the firm with a high margin of profitability. Sample size is 200. Results are given for the last 10 samples: SAMPLE 12 3 45678 9 10 DEFECTIVES a) Establish upper and lower control limits for the control chart and graph the data. b) Has the process been in control? c) If the sample size were 100...
The results of inspection of DNA samples taken over the past 10 days are given below. Sample size is 100. 10 Day Defectives 2 3 4 6 6 0 6 a) The upper and lower 3-sigma control chart limits are: UCLp...
 The results of inspection of DNA samples taken over the past 10 days are given below. Sample size is 100. 10 Day Defectives 2 3 4 6 6 0 6 a) The upper and lower 3-sigma control chart limits are: UCLp(enter your response as a number between 0 and 1, rounded to three decimal places). LCL(enter your response as a number between 0 and 1, rounded to three decimal places). b) Given the limits in part a, is the process...
kon over the past 10 days are given below. Sample size is 100. Day Defectives 1...
 kon over the past 10 days are given below. Sample size is 100. Day Defectives 1 7 2 9 3 9 4 11 5 7 6 8 7 0 8 11 9 13 10 2 a) The upper and lower 3-sigma control chart limits are: UCL, -(enter your response as a number between 0 and 1, rounded to three decimal places). LCL - Center your response as a number between 0 and 1, rounded to three decimal plocos). b) Given...
i dont have any more informafoon to add besides rhis pther example of tne type of...
 i
dont have any more informafoon to add besides rhis pther example of
tne type of problem
0405/20 1:47 Homework: Chapter S6 Homework Score: 0 of 1 pt + 2 of 7 (4 complete) Problem 6s.16 HW Score: 46.43%, 3.25 of The defect rate for your product has historically been about 1.00%. For a sample size of 400, the upper and lower 3-sigma control chart limits are: Question Help UCL = enter your response as a number between 0 and...
i
dont have any more informafoon to add besides rhis pther example of
tne type of problem
0405/20 1:47 Homework: Chapter S6 Homework Score: 0 of 1 pt + 2 of 7 (4 complete) Problem 6s.16 HW Score: 46.43%, 3.25 of The defect rate for your product has historically been about 1.00%. For a sample size of 400, the upper and lower 3-sigma control chart limits are: Question Help UCL = enter your response as a number between 0 and...
please help as soon as possible The results of inspection of DNA samples taken over the...
 please help as soon as possible
The results of inspection of DNA samples taken over the past 10 days are given below. Sample size is 100 10 Defectives 6 6 a) The upper and lower 3-sigma control chart limits are UCLp(enter your response as a number between 0 and 1, rounded to three decimal places) LCLenter your response as a number between 0 and 1, rounded to three decimal places) b) Given the limits in part a, is the process...
please help as soon as possible
The results of inspection of DNA samples taken over the past 10 days are given below. Sample size is 100 10 Defectives 6 6 a) The upper and lower 3-sigma control chart limits are UCLp(enter your response as a number between 0 and 1, rounded to three decimal places) LCLenter your response as a number between 0 and 1, rounded to three decimal places) b) Given the limits in part a, is the process...
re, 20.15% & Problem 6s.16 The defect rate for your product has histoncally been about 2...
 re, 20.15% & Problem 6s.16 The defect rate for your product has histoncally been about 2 00%. For a sample size of 100, the upper and lower 3-sigma control chart limits are: UCL LCL 0620 (enter your response as a number between 0 and 1, rounded to four decimal places) (enter your response as a number behween 0 and 1, rounded to four decimal places)
Sample No. 1 2 3 4 5 6 No. Defectives 7 5 20 10 12 7...
 Sample No. 1 2 3 4 5 6 No. Defectives 7 5 20 10 12 7 13 10 5 12 Sample No. 11 12 13 14 15 16 17 18 19 20 No. Defectives 6 6 15 4 12 7 12 3 19 16 Sample No. 21 22 23 24 25 26 27 28 29 30 No. Defectives 17 13 5 7 14 9 13 6 13 3 7 8 9 10 a) Establish 3a upper and lower controllimits. UCL...
Five data entry operators work at the data processing department of the Birmingham Bank. Each day...
 Five data entry operators work at the data processing department of the Birmingham Bank. Each day for 30 days, the number of defective records in a sample of 300 records typed by these operators has been noted. as follows: Sample No 1 No. Defectives Sample No. 11 12 13 No Defectives 5 2 No. Defectives 16 11 7 7 3 Sample No. 21 22 23 24 25 26 27 18 11 11 7 11 10 5 13 5 6 7...
 5. Metropolis Supply Company manufactures paper clips and other office products. Although inexpensive, paper clips have provided the firm with a high margin of profitability. So, it is important to monitor closely the number of clips produced that are bad and cannot be sold. Samples of size 200 are selected each day and the number of bad clips is determined, below are the results for the last 10 samples (remember each sample is 200 paper clips): 1 1 2 3...
 Must have hand calculations. Thank you.
S6.20Jamison Kovach Supply Company manufactures paper clips and other office products. Although inexpen- sive, paper clips have provided the firm with a high margin of profitability. Sample size is 200. Results are given for the last 10 samples: SAMPLE 12 3 45678 9 10 DEFECTIVES a) Establish upper and lower control limits for the control chart and graph the data. b) Has the process been in control? c) If the sample size were 100...
Must have hand calculations. Thank you.
S6.20Jamison Kovach Supply Company manufactures paper clips and other office products. Although inexpen- sive, paper clips have provided the firm with a high margin of profitability. Sample size is 200. Results are given for the last 10 samples: SAMPLE 12 3 45678 9 10 DEFECTIVES a) Establish upper and lower control limits for the control chart and graph the data. b) Has the process been in control? c) If the sample size were 100...
 The results of inspection of DNA samples taken over the past 10 days are given below. Sample size is 100. 10 Day Defectives 2 3 4 6 6 0 6 a) The upper and lower 3-sigma control chart limits are: UCLp(enter your response as a number between 0 and 1, rounded to three decimal places). LCL(enter your response as a number between 0 and 1, rounded to three decimal places). b) Given the limits in part a, is the process...
 kon over the past 10 days are given below. Sample size is 100. Day Defectives 1 7 2 9 3 9 4 11 5 7 6 8 7 0 8 11 9 13 10 2 a) The upper and lower 3-sigma control chart limits are: UCL, -(enter your response as a number between 0 and 1, rounded to three decimal places). LCL - Center your response as a number between 0 and 1, rounded to three decimal plocos). b) Given...
 i
dont have any more informafoon to add besides rhis pther example of
tne type of problem
0405/20 1:47 Homework: Chapter S6 Homework Score: 0 of 1 pt + 2 of 7 (4 complete) Problem 6s.16 HW Score: 46.43%, 3.25 of The defect rate for your product has historically been about 1.00%. For a sample size of 400, the upper and lower 3-sigma control chart limits are: Question Help UCL = enter your response as a number between 0 and...
i
dont have any more informafoon to add besides rhis pther example of
tne type of problem
0405/20 1:47 Homework: Chapter S6 Homework Score: 0 of 1 pt + 2 of 7 (4 complete) Problem 6s.16 HW Score: 46.43%, 3.25 of The defect rate for your product has historically been about 1.00%. For a sample size of 400, the upper and lower 3-sigma control chart limits are: Question Help UCL = enter your response as a number between 0 and...
 please help as soon as possible
The results of inspection of DNA samples taken over the past 10 days are given below. Sample size is 100 10 Defectives 6 6 a) The upper and lower 3-sigma control chart limits are UCLp(enter your response as a number between 0 and 1, rounded to three decimal places) LCLenter your response as a number between 0 and 1, rounded to three decimal places) b) Given the limits in part a, is the process...
please help as soon as possible
The results of inspection of DNA samples taken over the past 10 days are given below. Sample size is 100 10 Defectives 6 6 a) The upper and lower 3-sigma control chart limits are UCLp(enter your response as a number between 0 and 1, rounded to three decimal places) LCLenter your response as a number between 0 and 1, rounded to three decimal places) b) Given the limits in part a, is the process...
 re, 20.15% & Problem 6s.16 The defect rate for your product has histoncally been about 2 00%. For a sample size of 100, the upper and lower 3-sigma control chart limits are: UCL LCL 0620 (enter your response as a number between 0 and 1, rounded to four decimal places) (enter your response as a number behween 0 and 1, rounded to four decimal places)
 Sample No. 1 2 3 4 5 6 No. Defectives 7 5 20 10 12 7 13 10 5 12 Sample No. 11 12 13 14 15 16 17 18 19 20 No. Defectives 6 6 15 4 12 7 12 3 19 16 Sample No. 21 22 23 24 25 26 27 28 29 30 No. Defectives 17 13 5 7 14 9 13 6 13 3 7 8 9 10 a) Establish 3a upper and lower controllimits. UCL...
 Five data entry operators work at the data processing department of the Birmingham Bank. Each day for 30 days, the number of defective records in a sample of 300 records typed by these operators has been noted. as follows: Sample No 1 No. Defectives Sample No. 11 12 13 No Defectives 5 2 No. Defectives 16 11 7 7 3 Sample No. 21 22 23 24 25 26 27 18 11 11 7 11 10 5 13 5 6 7...
Most questions answered within 3 hours.
-
A distribution center for a sporting goods retailer places
orders with manufacturers for a variety of...
asked 6 minutes ago -
Suppose you have a bag of Skittles with 27 blue Skittles, 18
green
Skittles, 32 red...
asked 9 minutes ago -
Sketch the circuit diagram for an inverting amplifier, and give
component values that will produce a...
asked 12 minutes ago -
Develop in C language the function whose prototype is described
below. Please, send the entire code,...
asked 30 minutes ago -
What single payment today would replace a payment stream of
$50,000 that will be paid today,...
asked 23 minutes ago -
please c++ with functions *Modify the Guessing Game Write the
secret number to a file. Then...
asked 24 minutes ago -
Question about ACID/BASE. Equal volumes of 0.230 M weak base (Kb
= 4.0× 10⁻⁹) and 0.230...
asked 29 minutes ago -
The charges and coordinates of two charged particles held fixed
in an xy plane are q1...
asked 31 minutes ago -
A particle of mass M = 7.5 kg is at a position r = (-3 i...
asked 31 minutes ago -
Please answer the question below with complete explanation and a
light rays drawing of the concave...
asked 34 minutes ago -
On January 4th, Stevens Manufacturing received an
order for 30 uniforms. The following information pertained to...
asked 43 minutes ago -
what is the present value of a 3 year growing annuity with the
first payment of...
asked 50 minutes ago