


Homework Answers
 d.
d.
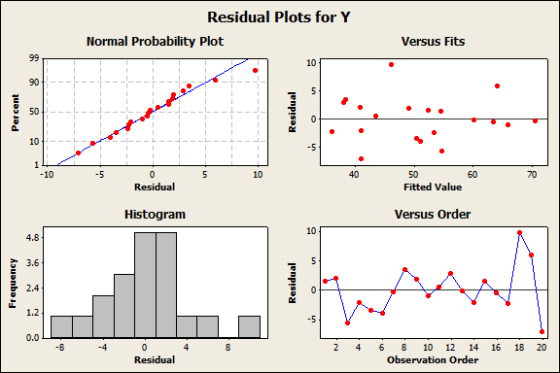
From normal probability plot it is observed that residuals are normally distributed. From Fitted vs Residual plot we observed that linearity assumption and equal variance assumptions are hold.

| Y | X1 | X2 | SUMMARY OUTPUT | |||||||
| 56 | 45.3 | 38.9 | ||||||||
| 43 | 43.2 | 33.8 | Regression Statistics | |||||||
| 49 | 45.5 | 32.4 | Multiple R | 0.932923622 | ||||||
| 34 | 42.5 | 30.6 | R Square | 0.870346484 | ||||||
| 47 | 44.7 | 36.5 | Adjusted R Square | 0.855093129 | ||||||
| 47 | 44.8 | 36.1 | Standard Error | 4.145410663 | ||||||
| 70 | 47.9 | 39.7 | Observations | 20 | ||||||
| 42 | 42.8 | 33.5 | ||||||||
| 51 | 44.5 | 35.6 | ANOVA | |||||||
| 65 | 47.2 | 38.3 | df | SS | MS | F | Significance F | |||
| 44 | 43.6 | 34.6 | Regression | 2 | 1961.064697 | 980.5323 | 57.05935 | 2.87519E-08 | ||
| 41 | 42.7 | 34.9 | Residual | 17 | 292.1353026 | 17.18443 | ||||
| 60 | 46.3 | 36.5 | Total | 19 | 2253.2 | |||||
| 39 | 43.2 | 34.7 | ||||||||
| 54 | 45.1 | 33.5 | Coefficients | Standard Error | t Stat | P-value | Lower 95% | Upper 95% | ||
| 63 | 46.9 | 34.1 | Intercept | -226.3908473 | 26.22907596 | -8.63129 | 1.28E-07 | -281.7293603 | -171.052334 | |
| 51 | 45.2 | 35.2 | X Variable 1 | 6.069729193 | 0.764469473 | 7.939793 | 4.04E-07 | 4.45683959 | 7.682618796 | |
| 56 | 44.1 | 32.5 | X Variable 2 | 0.153144067 | 0.545461997 | 0.28076 | 0.782283 | -0.997680152 | 1.303968286 | |
| 70 | 46.9 | 37.6 | ||||||||
| 34 | 43.2 | 34.7 | ||||||||
Add Answer to:
Wins Data B C A Three-Point Field Goal % Field Goal % 1 Wins 38.9 56...
Question 100) Professional basketball has truly become a sport that generates interest among fans around the...
Question 100) Professional basketball has truly become a sport that generates interest among fans around the world. More and more players come from outside the United States to play in the National Basketball Association (NBA). You want to develop a regression model to predict the number of wins achieved by each NBA team, based on field goal (shots made) percentage and three-point field goal percentage. 1) Estimate the following multiple regression model (copy and paste the results from either Minitab...
please show work, see data attached Question 5 (25pts) Suppose the athletic director at a university...
 please show work, see data attached
Question 5 (25pts) Suppose the athletic director at a university would like to develop a regression model to predict the point differential for games played by the men's basketball team. A point differential is the difference between the final points scored by two competing teams. A positive differential is a win, and a negative differential is a loss. For a random sample of games, the point differential was calculated, along with the number of...
please show work, see data attached
Question 5 (25pts) Suppose the athletic director at a university would like to develop a regression model to predict the point differential for games played by the men's basketball team. A point differential is the difference between the final points scored by two competing teams. A positive differential is a win, and a negative differential is a loss. For a random sample of games, the point differential was calculated, along with the number of...
> The accompanying data are the number of wins and the earned run averages (mean number...
 > The accompanying data are the number of wins and the earned run averages (mean number of earned runs allowed per nine innings pitched) for eight baseball pitchers in a recent season. Find the equation of the regression line. Then construct a scatter plot of the data and draw the regression line. Then use the regression equation to predict the value of y for each of the given x-values, if meaningful. If the x-value is not meaningful to predict the...
All teams have a goal to make the postseason playoffs. A basketball team thinks that it...
 All teams have a goal to make the postseason playoffs. A
basketball team thinks that it can make the playoffs next year if
it wins 10 more games. How much should the basketball team increase
its payroll if it wants to make the playoffs next year?
Note: Use 2 decimal places. Your answer should
be in units of $1 million; do NOT include a dollar sign in the
answer; for example, if a team should increase its payroll by
$5,250,000,...
All teams have a goal to make the postseason playoffs. A
basketball team thinks that it can make the playoffs next year if
it wins 10 more games. How much should the basketball team increase
its payroll if it wants to make the playoffs next year?
Note: Use 2 decimal places. Your answer should
be in units of $1 million; do NOT include a dollar sign in the
answer; for example, if a team should increase its payroll by
$5,250,000,...
The National Football League (NFL) records a variety of performance data for Individuals and team...
 The National Football League (NFL) records a variety of performance data for Individuals and teams. To investigate the importance of passing on the percentage of games won by a team, the following data show the average number of passing yards per attempt (Yds/Att) and the percentage of games won (Win96) for a random sample of 10 NFL teams. Team Team 1 Team 2 Team 3 Team 4 Team 5 Team б Team 7 Team 8 Team 9 Team 10 Yds/Att...
Find the equation of the regression line for the given data. Then construct a scatter plot...
 Find the equation of the regression line for the given data. Then construct a scatter plot of the data and draw the regression line. (The pair of variables have a significa correlation.) Then use the regression equation to predict the value of y for each of the given x-values, if meaningful. The table below shows the heights (in feet) and the number of stories of six notable buildings in a city. Height, x 758 621 518 510 492 483 (a)...
please show all the work. if you use excel please show the screenshots. Thank you !...
 please show all the work. if you use excel please show the
screenshots. Thank you !
Question 5 (25pts) Suppose the athletic director at a university would like to develop a regression model to predict the point differential for games played by the men's basketball team. A point differential is the difference between the final points scored by two competing teams. A positive differential is a win, and a negative differential is a loss. For a random sample of games,...
please show all the work. if you use excel please show the
screenshots. Thank you !
Question 5 (25pts) Suppose the athletic director at a university would like to develop a regression model to predict the point differential for games played by the men's basketball team. A point differential is the difference between the final points scored by two competing teams. A positive differential is a win, and a negative differential is a loss. For a random sample of games,...
The following table shows the number of wins eight teams had during a football season. Also...
 The following table shows the number of wins eight teams had during a football season. Also shown are the average points each team scored per game during the season. Construct a 90% confidence interval to estimate the average number of wins for teams that scored an average of 22 points a game. Click the icon to view the data table. Determine the upper and lower limits of the confidence interval. UCL = LCL = (Round to three decimal places as...
please help. i figured out the chart but i need help with b-e. on the percentage...
 please help. i figured out the chart but i need help
with b-e.
on the percentage of games won by a team the following data show the average number of passing yards per attempt (Yards/Attempt) and The National Football League (NFL) records a variety of performance data for individuals and teams. To investigate the importance of passing the percentage of games won (WinPct) for a random sample of 10 NFL teams for the 2011 season, DATAfie: NFLPassing Team Yards/Attempt WinPct...
please help. i figured out the chart but i need help
with b-e.
on the percentage of games won by a team the following data show the average number of passing yards per attempt (Yards/Attempt) and The National Football League (NFL) records a variety of performance data for individuals and teams. To investigate the importance of passing the percentage of games won (WinPct) for a random sample of 10 NFL teams for the 2011 season, DATAfie: NFLPassing Team Yards/Attempt WinPct...
The following table gives data on the Boston Red Sox wins and runs. Construct a scatterplot...
The following table gives data on the Boston Red Sox wins and runs. Construct a scatterplot with runs on the horizontal axis and wins on the vertical axis. a) Do you think there is a linear relationship between the number of runs and the number of wins in a given year? b) The linear regression line for the data is: Wins = 24.5+ 0.08 Runs. Use this model to predict the number of wins the Red Socks would have in...
 please show work, see data attached
Question 5 (25pts) Suppose the athletic director at a university would like to develop a regression model to predict the point differential for games played by the men's basketball team. A point differential is the difference between the final points scored by two competing teams. A positive differential is a win, and a negative differential is a loss. For a random sample of games, the point differential was calculated, along with the number of...
please show work, see data attached
Question 5 (25pts) Suppose the athletic director at a university would like to develop a regression model to predict the point differential for games played by the men's basketball team. A point differential is the difference between the final points scored by two competing teams. A positive differential is a win, and a negative differential is a loss. For a random sample of games, the point differential was calculated, along with the number of...
 > The accompanying data are the number of wins and the earned run averages (mean number of earned runs allowed per nine innings pitched) for eight baseball pitchers in a recent season. Find the equation of the regression line. Then construct a scatter plot of the data and draw the regression line. Then use the regression equation to predict the value of y for each of the given x-values, if meaningful. If the x-value is not meaningful to predict the...
 All teams have a goal to make the postseason playoffs. A
basketball team thinks that it can make the playoffs next year if
it wins 10 more games. How much should the basketball team increase
its payroll if it wants to make the playoffs next year?
Note: Use 2 decimal places. Your answer should
be in units of $1 million; do NOT include a dollar sign in the
answer; for example, if a team should increase its payroll by
$5,250,000,...
All teams have a goal to make the postseason playoffs. A
basketball team thinks that it can make the playoffs next year if
it wins 10 more games. How much should the basketball team increase
its payroll if it wants to make the playoffs next year?
Note: Use 2 decimal places. Your answer should
be in units of $1 million; do NOT include a dollar sign in the
answer; for example, if a team should increase its payroll by
$5,250,000,...
 The National Football League (NFL) records a variety of performance data for Individuals and teams. To investigate the importance of passing on the percentage of games won by a team, the following data show the average number of passing yards per attempt (Yds/Att) and the percentage of games won (Win96) for a random sample of 10 NFL teams. Team Team 1 Team 2 Team 3 Team 4 Team 5 Team б Team 7 Team 8 Team 9 Team 10 Yds/Att...
 Find the equation of the regression line for the given data. Then construct a scatter plot of the data and draw the regression line. (The pair of variables have a significa correlation.) Then use the regression equation to predict the value of y for each of the given x-values, if meaningful. The table below shows the heights (in feet) and the number of stories of six notable buildings in a city. Height, x 758 621 518 510 492 483 (a)...
 please show all the work. if you use excel please show the
screenshots. Thank you !
Question 5 (25pts) Suppose the athletic director at a university would like to develop a regression model to predict the point differential for games played by the men's basketball team. A point differential is the difference between the final points scored by two competing teams. A positive differential is a win, and a negative differential is a loss. For a random sample of games,...
please show all the work. if you use excel please show the
screenshots. Thank you !
Question 5 (25pts) Suppose the athletic director at a university would like to develop a regression model to predict the point differential for games played by the men's basketball team. A point differential is the difference between the final points scored by two competing teams. A positive differential is a win, and a negative differential is a loss. For a random sample of games,...
 The following table shows the number of wins eight teams had during a football season. Also shown are the average points each team scored per game during the season. Construct a 90% confidence interval to estimate the average number of wins for teams that scored an average of 22 points a game. Click the icon to view the data table. Determine the upper and lower limits of the confidence interval. UCL = LCL = (Round to three decimal places as...
 please help. i figured out the chart but i need help
with b-e.
on the percentage of games won by a team the following data show the average number of passing yards per attempt (Yards/Attempt) and The National Football League (NFL) records a variety of performance data for individuals and teams. To investigate the importance of passing the percentage of games won (WinPct) for a random sample of 10 NFL teams for the 2011 season, DATAfie: NFLPassing Team Yards/Attempt WinPct...
please help. i figured out the chart but i need help
with b-e.
on the percentage of games won by a team the following data show the average number of passing yards per attempt (Yards/Attempt) and The National Football League (NFL) records a variety of performance data for individuals and teams. To investigate the importance of passing the percentage of games won (WinPct) for a random sample of 10 NFL teams for the 2011 season, DATAfie: NFLPassing Team Yards/Attempt WinPct...
Most questions answered within 3 hours.
-
Cranium, Inc., purchases term papers from an overseas supplier
under a continuous review system. The average...
asked 2 hours ago -
1- What is the freezing point of pure water (in degrees
Celsius)?
2-
he molar mass...
asked 3 hours ago -
Determine the direction of the force that will act on the charge
in each of the...
asked 3 hours ago -
You purchase your daily coffee at the Chemist’s Coffeehouse and
have a choice of two cups:...
asked 6 hours ago -
Which of the following pairs of chemicals could be used to make
a buffer solution?
A.)...
asked 6 hours ago -
Problem 16-51 Sales
Activity Variance (LO 16-3)Odessa, Inc., reports the following
information concerning operations for the...
asked 6 hours ago -
Pictured on the right are thee point charges Q1 = 18.4 μC, Q2 =
-30.6 μC,...
asked 6 hours ago -
A graduate student is conducting research in psychology and
needs to obtain the IQ scores of...
asked 7 hours ago -
R2.84: There are 2 defective products in a production lot of 10.
An inspector randomly selected...
asked 8 hours ago -
Consider the following equilibrium system: COCl2(g) CO(g) +
Cl2(g) A 10.00 L evacuated flask is filled...
asked 9 hours ago -
1) What are the two distinct steps that one needs to perform
when developing a data...
asked 9 hours ago -
2) Write a C++ program that uses a class called “Degree” to
obtain the trigonometric
values...
asked 10 hours ago