
b. What does the scatter diagram developed in part (a) indicate about the relationship between the two variables? The scatter diagram Indicates a Select your answer lnear relationship between r average number of passing yards per attempt and y the percentage of games won by the teanm C. Develop the estimated regression equation that could be used to predict the percentage of games won glven the average number of passing yards per attempt. Enter negative value as negative number (Yds/Att) (to 2 decimals) d. Provide an interpretation for the slope of the estimated regression equation (to 1 decimal) The slope of the estimated regression line is approximately .So, for every Select your answer of one yard in the average number of passes per attempt, the percentage of games won by the team increases by e. The average number of passing yards per attempt for the other Team was 5.6. Use the estimated regression equation developed in part (c) to predict the percentage of games won by the team. % (to 2 decimals)
Homework Answers
b)

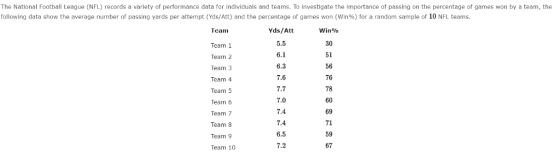
scatterplot,diagram indicates a positive linear reltionship
c)
excel o/p usinh data analyis tool for regression given below,
| SUMMARY OUTPUT | ||||||||
| Regression Statistics | ||||||||
| Multiple R | 0.96636 | |||||||
| R Square | 0.933851 | |||||||
| Adjusted R Square | 0.925583 | |||||||
| Standard Error | 3.85802 | |||||||
| Observations | 10 | |||||||
| ANOVA | ||||||||
| df | SS | MS | F | Significance F | ||||
| Regression | 1 | 1681.025 | 1681.025 | 112.9393 | 5.38E-06 | |||
| Residual | 8 | 119.0746 | 14.88432 | |||||
| Total | 9 | 1800.1 | ||||||
| Coefficients | Standard Error | t Stat | P-value | Lower 95% | Upper 95% | Lower 95.0% | Upper 95.0% | |
| Intercept | -66.3196 | 12.10792 | -5.47737 | 0.000589 | -94.2405 | -38.3986 | -94.2405 | -38.3986 |
| YDS/ATT | 18.63458 | 1.753465 | 10.62729 | 5.38E-06 | 14.59108 | 22.67808 | 14.59108 | 22.67808 |
from, here,
Win % = -66.32 + 18.63*yds/att
d)
the slope of estimated regression equation is approximately 18.6, so, for every unit increase of one yard, in the avergae number of passes per attempt,the percentage of games won increases by 18.63%
e)
x=5.6
Win % = -66.32 + 18.63*5.6 = 38.03%(answer)
Add Answer to:
The National Football League (NFL) records a variety of performance data for Individuals and team...
The National Football League (NFL) records a variety of performance data for individuals and team...
 The National Football League (NFL) records a variety of performance data for individuals and teams. To investigate the importance of passing on the percentage of games won by a team, the following data show the conference (Conf), average number of passing yards per attempt (Yds/Att), the number of interceptions thrown per attempt (Int/Att), and the percentage of games won (Win96) for a random sample of 16 NFL teams for a season Conf NFC NFC NFC AFC NFC NFC AFC AFC...
The National Football League (NFL) records a variety of performance data for individuals and team...
 The National Football League (NFL) records a variety of performance data for individuals and teams. To investigate the importance of passing on the percentage of games won by a team, the data in the Excel Online file below show the conference (Conf), average number of passing yards per attempt (Yds/Att), the number of interceptions thrown per attempt (Int/Att), and the percentage of games won (Win96) for a random sample of 16 NFL teams for a season. Construct a spreadsheet to...
The National Football League (NFL) records a variety of performance data for individuals and teams. To investigate the importance of passing on the percentage of games won by a team, the data in the...
 The National Football League (NFL) records a variety of performance data for individuals and teams. To investigate the importance of passing on the percentage of games won by a team, the data in the Excel Online file below show the conference (Conf), average number of passing yards per attempt (Yds/Att), the number of interceptions thrown per attempt (Int/Att), and the percentage of games won (Win96) for a random sample of 16 NFL teams for a season. Construct a spreadsheet to...
The National Faotball League (NFL) records a variety of perfarmance data for individuals and teams. To investigate the...
 The National Faotball League (NFL) records a variety of perfarmance data for individuals and teams. To investigate the importance of passing an the percentage games wan by a team, the following data show the average number af passing yards per attempt (Yds/Att) and the percentage of games won (Win% ) for a random sample of 10 NFL teams. Team Yds/Att Win% Team 5.9 41 79 Теem 8.4 39 Теаm 5.9 Теаm 7,8 70 59 Тeam 7.5 5 16 Теаm S.0...
The National Football League (NFL) records a variety of performance data for individuals and teams. To investigate the importance of passing on the percentage of games won by a team, the following d...
 The National Football League (NFL) records a variety of performance data for individuals and teams. To investigate the importance of passing on the percentage of games won by a team, the following data show the conference (Conf), average number of passing yards per attempt (Yds/Att), the number of interceptions thrown per attempt (Int/Att), and the percentage of games won (win96) for a random sample of 16 NFL teams for a season Conf NFC NFC NFC AFC NFC NFC AFC AFC...
The National Football League (NFL) records a variety of performance data for individuals and teams. To...
 The National Football League (NFL) records a variety of performance data for individuals and teams. To investigate the importance of passing on the percentage of games won by a team, the data in the Excel Online file below show the conference (Conf), average number of passing yards per attempt (Yds/Att), the number of interceptions thrown per attempt (Int/Att), and the percentage of games won (Win%) for a random sample of 16 NFL teams for a season. Construct a spreadsheet to...
The National Football League (NFL) records a variety of performance data for individuals and teams. To investigate the...
 The National Football League (NFL) records a variety of performance data for individuals and teams. To investigate the importance of passing on the percentage of games won by a team, the passing yards per attempt (Yds/Att), the number of interceptions thrown per attempt (Int/Att), and the percentage of games won following data show the conference (Conf), average number (Win%) for a random sample of 16 NFL teams for a season Team Conf Yds/Att Int/Att Win% Arizona Cardinals NFC 6.7 0.043...
The National Football League (NFL) records a variety of performance data for individuals and teams. ail...
 The
National Football League (NFL) records a variety of performance
data for individuals and teams.
ail Sprint Wi-Fi 9:52 PM 18% Access WebAssign My Notes Previous Answers DATAfile: NFLPassing A statistical program is recommended The National Football League (NFL) records a variety of performance data for individuals and teams. To investigate the importance of passing on the percentage of games won by a team, the following data show the conference (Conf), average number of passing yards per attempt (Yds/Att), the...
The
National Football League (NFL) records a variety of performance
data for individuals and teams.
ail Sprint Wi-Fi 9:52 PM 18% Access WebAssign My Notes Previous Answers DATAfile: NFLPassing A statistical program is recommended The National Football League (NFL) records a variety of performance data for individuals and teams. To investigate the importance of passing on the percentage of games won by a team, the following data show the conference (Conf), average number of passing yards per attempt (Yds/Att), the...
X Excel: Structured Activity- NFLPassing The National Football League (NFL) records a variety of performance data...
 X Excel: Structured Activity- NFLPassing The National Football League (NFL) records a variety of performance data for Individuals and teams. To Investigate the importance of passing on the percentage of games won by a team, the data in the Excel Online file below show the conference (Conf), average number of passing yards per attempt (Yds/Att), the number of interceptions thrown per attempt (Int/Att), and the percentage of games won (Win %) for a random sample of 16 NFL teams for...
he National Football Leaque (NFL) records a variety of performance data for individuals and teams. To...
 he National Football Leaque (NFL) records a variety of performance data for individuals and teams. To investigate the importance of passing on the percentage of games won by a team, the following data show the conference (Cont), average number of passing yards per attempt(Yds/Att), the number of interceptions thrown per attempt (Inset), and the percentage of games _ (Wm%) for random un ple of 16 NF, tram, for a eason Team Arizona Cardinals 6.4 7.3 7.3 5.2 7,.3 8.8 6...
 The National Football League (NFL) records a variety of performance data for individuals and teams. To investigate the importance of passing on the percentage of games won by a team, the following data show the conference (Conf), average number of passing yards per attempt (Yds/Att), the number of interceptions thrown per attempt (Int/Att), and the percentage of games won (Win96) for a random sample of 16 NFL teams for a season Conf NFC NFC NFC AFC NFC NFC AFC AFC...
 The National Football League (NFL) records a variety of performance data for individuals and teams. To investigate the importance of passing on the percentage of games won by a team, the data in the Excel Online file below show the conference (Conf), average number of passing yards per attempt (Yds/Att), the number of interceptions thrown per attempt (Int/Att), and the percentage of games won (Win96) for a random sample of 16 NFL teams for a season. Construct a spreadsheet to...
 The National Football League (NFL) records a variety of performance data for individuals and teams. To investigate the importance of passing on the percentage of games won by a team, the data in the Excel Online file below show the conference (Conf), average number of passing yards per attempt (Yds/Att), the number of interceptions thrown per attempt (Int/Att), and the percentage of games won (Win96) for a random sample of 16 NFL teams for a season. Construct a spreadsheet to...
 The National Faotball League (NFL) records a variety of perfarmance data for individuals and teams. To investigate the importance of passing an the percentage games wan by a team, the following data show the average number af passing yards per attempt (Yds/Att) and the percentage of games won (Win% ) for a random sample of 10 NFL teams. Team Yds/Att Win% Team 5.9 41 79 Теem 8.4 39 Теаm 5.9 Теаm 7,8 70 59 Тeam 7.5 5 16 Теаm S.0...
 The National Football League (NFL) records a variety of performance data for individuals and teams. To investigate the importance of passing on the percentage of games won by a team, the following data show the conference (Conf), average number of passing yards per attempt (Yds/Att), the number of interceptions thrown per attempt (Int/Att), and the percentage of games won (win96) for a random sample of 16 NFL teams for a season Conf NFC NFC NFC AFC NFC NFC AFC AFC...
 The National Football League (NFL) records a variety of performance data for individuals and teams. To investigate the importance of passing on the percentage of games won by a team, the data in the Excel Online file below show the conference (Conf), average number of passing yards per attempt (Yds/Att), the number of interceptions thrown per attempt (Int/Att), and the percentage of games won (Win%) for a random sample of 16 NFL teams for a season. Construct a spreadsheet to...
 The National Football League (NFL) records a variety of performance data for individuals and teams. To investigate the importance of passing on the percentage of games won by a team, the passing yards per attempt (Yds/Att), the number of interceptions thrown per attempt (Int/Att), and the percentage of games won following data show the conference (Conf), average number (Win%) for a random sample of 16 NFL teams for a season Team Conf Yds/Att Int/Att Win% Arizona Cardinals NFC 6.7 0.043...
 The
National Football League (NFL) records a variety of performance
data for individuals and teams.
ail Sprint Wi-Fi 9:52 PM 18% Access WebAssign My Notes Previous Answers DATAfile: NFLPassing A statistical program is recommended The National Football League (NFL) records a variety of performance data for individuals and teams. To investigate the importance of passing on the percentage of games won by a team, the following data show the conference (Conf), average number of passing yards per attempt (Yds/Att), the...
The
National Football League (NFL) records a variety of performance
data for individuals and teams.
ail Sprint Wi-Fi 9:52 PM 18% Access WebAssign My Notes Previous Answers DATAfile: NFLPassing A statistical program is recommended The National Football League (NFL) records a variety of performance data for individuals and teams. To investigate the importance of passing on the percentage of games won by a team, the following data show the conference (Conf), average number of passing yards per attempt (Yds/Att), the...
 X Excel: Structured Activity- NFLPassing The National Football League (NFL) records a variety of performance data for Individuals and teams. To Investigate the importance of passing on the percentage of games won by a team, the data in the Excel Online file below show the conference (Conf), average number of passing yards per attempt (Yds/Att), the number of interceptions thrown per attempt (Int/Att), and the percentage of games won (Win %) for a random sample of 16 NFL teams for...
 he National Football Leaque (NFL) records a variety of performance data for individuals and teams. To investigate the importance of passing on the percentage of games won by a team, the following data show the conference (Cont), average number of passing yards per attempt(Yds/Att), the number of interceptions thrown per attempt (Inset), and the percentage of games _ (Wm%) for random un ple of 16 NF, tram, for a eason Team Arizona Cardinals 6.4 7.3 7.3 5.2 7,.3 8.8 6...
Most questions answered within 3 hours.
-
Are there such things as microscopic multicellular animal
parasites? If so, please give examples.
asked 28 minutes ago -
1. What two structures in the ear are involved in your
sense of balance and in...
asked 15 minutes ago -
Two ice skaters suddenly push off against one another starting
from a stationary position. The 45...
asked 16 minutes ago -
What is the Larmor frequency for a proton in a magnetic field of
B0 = 14.0...
asked 17 minutes ago -
Problem 03.019 Annual Worth Calculations
Find the value of x that makes the equivalent annual
worth...
asked 33 minutes ago -
Under common law, right of survivorship was automatically a
feature of which type of co-tenancy?
a....
asked 29 minutes ago -
At 1 bar, how much energy is required to heat 61.0 g of H2O(s)
at −12.0...
asked 50 minutes ago -
Find the mixed-strategy equilibrium to the Battle of the sexes
game in Figure 5.1 below
Hockey...
asked 52 minutes ago -
Use the following information to answer the next three
questions.
QUESTION 5
As of today, the...
asked 57 minutes ago -
Using the specific identification method: Date Units purchased
Cost per unit Ending inventory March 1 15...
asked 1 hour ago -
PLEASE HELP, NO ONE IS ANSWERING MY QUESTION AND IT IS SUE TODAY
WORTH 20% OF...
asked 1 hour ago -
α = 0.0007889 T, I = 2.9 A
Other Magnetic Fields: First, based on your
value...
asked 1 hour ago