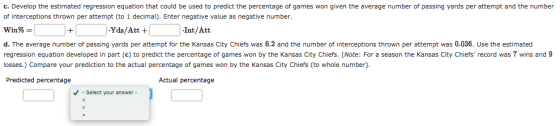
c. Develop the estimated regression equation that could be used to predict the percentage of games won given the average number of passing yards per attempt and the number of interceptions thrown per attempt (to 1 decimal). Enter negative value as negative number Win% d. The average number of passing yards per attempt for the Kansas City Chiefs was 6.2 and the number of interceptions thrown per attempt was 0.036. Use the estimated regression equation developed in part (c) to predict the percentage of games won by the Kansas City Chiefs. (Note: For a season the Kansas City Chiefs' record was 7 wins and 9 losses.) Compare your prediction to the actual percentage of games won by the Kansas City Chiefs (to whole number) Predicted percentagee .Yds/Att Int/Att Actual percentage Select your answer
Homework Answers
Answer:
a).
win% = -60.6+16.5*yds/att
b).
win%= 94.2 +(-1487.8)*Int/Att
c). win% = -14.4+13.3*yds/Att +(-889.9)*int/Att
d).
predicted percentage 36 < actual percentage 44
Excel Addon Megastat used.
Menu used: correlation/Regression ---- Regression Analysis.
|
Regression Analysis |
|||||||
|
r² |
0.603 |
n |
16 |
||||
|
r |
0.776 |
k |
1 |
||||
|
Std. Error of Estimate |
15.398 |
Dep. Var. |
winn% |
||||
|
Regression output |
confidence interval |
||||||
|
variables |
coefficients |
std. error |
t (df=14) |
p-value |
95% lower |
95% upper |
|
|
Intercept |
a = |
-60.597 |
|||||
|
ydsatt |
b = |
16.514 |
3.582 |
4.610 |
.0004 |
8.832 |
24.197 |
|
ANOVA table |
|||||||
|
Source |
SS |
df |
MS |
F |
p-value |
||
|
Regression |
5,039.831 |
1 |
5,039.831 |
21.26 |
.0004 |
||
|
Residual |
3,319.473 |
14 |
237.105 |
||||
|
Total |
8,359.304 |
15 |
|||||
|
Regression Analysis |
|||||||
|
r² |
0.393 |
n |
16 |
||||
|
r |
-0.627 |
k |
1 |
||||
|
Std. Error of Estimate |
19.036 |
Dep. Var. |
winn% |
||||
|
Regression output |
confidence interval |
||||||
|
variables |
coefficients |
std. error |
t (df=14) |
p-value |
95% lower |
95% upper |
|
|
Intercept |
a = |
94.173 |
|||||
|
intatt |
b = |
-1,487.807 |
494.088 |
-3.011 |
.0093 |
-2,547.521 |
-428.093 |
|
ANOVA table |
|||||||
|
Source |
SS |
df |
MS |
F |
p-value |
||
|
Regression |
3,285.905 |
1 |
3,285.905 |
9.07 |
.0093 |
||
|
Residual |
5,073.399 |
14 |
362.386 |
||||
|
Total |
8,359.304 |
15 |
|||||
|
Regression Analysis |
|||||||
|
R² |
0.721 |
||||||
|
Adjusted R² |
0.678 |
n |
16 |
||||
|
R |
0.849 |
k |
2 |
||||
|
Std. Error of Estimate |
13.402 |
Dep. Var. |
winn% |
||||
|
Regression output |
confidence interval |
||||||
|
variables |
coefficients |
std. error |
t (df=13) |
p-value |
95% lower |
95% upper |
|
|
Intercept |
a = |
-14.384 |
|||||
|
ydsatt |
b1 = |
13.301 |
3.406 |
3.905 |
.0018 |
5.942 |
20.660 |
|
intatt |
b2 = |
-889.874 |
380.047 |
-2.341 |
.0358 |
-1,710.916 |
-68.833 |
|
ANOVA table |
|||||||
|
Source |
SS |
df |
MS |
F |
p-value |
||
|
Regression |
6,024.500 |
2 |
3,012.250 |
16.77 |
.0003 |
||
|
Residual |
2,334.805 |
13 |
179.600 |
||||
|
Total |
8,359.304 |
15 |
|||||
|
Predicted values for: winn% |
|||||||
|
95% Confidence Interval |
95% Prediction Interval |
||||||
|
ydsatt |
intatt |
Predicted |
lower |
upper |
lower |
upper |
Leverage |
|
6.2 |
0.036 |
36.047 |
25.730 |
46.363 |
5.311 |
66.782 |
0.127 |
Add Answer to:
The National Football League (NFL) records a variety of performance data for individuals and team...
The National Football League (NFL) records a variety of performance data for individuals and teams. To investigate the...
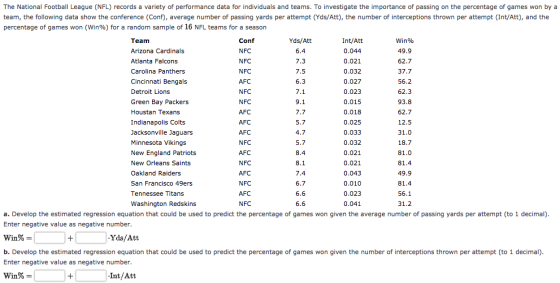
 The National Football League (NFL) records a variety of performance data for individuals and teams. To investigate the importance of passing on the percentage of games won by a team, the passing yards per attempt (Yds/Att), the number of interceptions thrown per attempt (Int/Att), and the percentage of games won following data show the conference (Conf), average number (Win%) for a random sample of 16 NFL teams for a season Team Conf Yds/Att Int/Att Win% Arizona Cardinals NFC 6.7 0.043...
The National Football League (NFL) records a variety of performance data for individuals and team...
 The National Football League (NFL) records a variety of performance data for individuals and teams. To investigate the importance of passing on the percentage of games won by a team, the data in the Excel Online file below show the conference (Conf), average number of passing yards per attempt (Yds/Att), the number of interceptions thrown per attempt (Int/Att), and the percentage of games won (Win96) for a random sample of 16 NFL teams for a season. Construct a spreadsheet to...
The National Football League (NFL) records a variety of performance data for individuals and teams. To investigate the importance of passing on the percentage of games won by a team, the following d...
 The National Football League (NFL) records a variety of performance data for individuals and teams. To investigate the importance of passing on the percentage of games won by a team, the following data show the conference (Conf), average number of passing yards per attempt (Yds/Att), the number of interceptions thrown per attempt (Int/Att), and the percentage of games won (win96) for a random sample of 16 NFL teams for a season Conf NFC NFC NFC AFC NFC NFC AFC AFC...
The National Football League (NFL) records a variety of performance data for individuals and teams. To investigate the importance of passing on the percentage of games won by a team, the data in the...
 The National Football League (NFL) records a variety of performance data for individuals and teams. To investigate the importance of passing on the percentage of games won by a team, the data in the Excel Online file below show the conference (Conf), average number of passing yards per attempt (Yds/Att), the number of interceptions thrown per attempt (Int/Att), and the percentage of games won (Win96) for a random sample of 16 NFL teams for a season. Construct a spreadsheet to...
The National Football League (NFL) records a variety of performance data for individuals and teams. To...
 The National Football League (NFL) records a variety of performance data for individuals and teams. To investigate the importance of passing on the percentage of games won by a team, the data in the Excel Online file below show the conference (Conf), average number of passing yards per attempt (Yds/Att), the number of interceptions thrown per attempt (Int/Att), and the percentage of games won (Win%) for a random sample of 16 NFL teams for a season. Construct a spreadsheet to...
X Excel: Structured Activity- NFLPassing The National Football League (NFL) records a variety of performance data...
 X Excel: Structured Activity- NFLPassing The National Football League (NFL) records a variety of performance data for Individuals and teams. To Investigate the importance of passing on the percentage of games won by a team, the data in the Excel Online file below show the conference (Conf), average number of passing yards per attempt (Yds/Att), the number of interceptions thrown per attempt (Int/Att), and the percentage of games won (Win %) for a random sample of 16 NFL teams for...
The National Football League (NFL) records a variety of performance data for individuals and teams. ail...
 The
National Football League (NFL) records a variety of performance
data for individuals and teams.
ail Sprint Wi-Fi 9:52 PM 18% Access WebAssign My Notes Previous Answers DATAfile: NFLPassing A statistical program is recommended The National Football League (NFL) records a variety of performance data for individuals and teams. To investigate the importance of passing on the percentage of games won by a team, the following data show the conference (Conf), average number of passing yards per attempt (Yds/Att), the...
The
National Football League (NFL) records a variety of performance
data for individuals and teams.
ail Sprint Wi-Fi 9:52 PM 18% Access WebAssign My Notes Previous Answers DATAfile: NFLPassing A statistical program is recommended The National Football League (NFL) records a variety of performance data for individuals and teams. To investigate the importance of passing on the percentage of games won by a team, the following data show the conference (Conf), average number of passing yards per attempt (Yds/Att), the...
The National Football League (NFL) records a variety of performance data for Individuals and team...
 The National Football League (NFL) records a variety of performance data for Individuals and teams. To investigate the importance of passing on the percentage of games won by a team, the following data show the average number of passing yards per attempt (Yds/Att) and the percentage of games won (Win96) for a random sample of 10 NFL teams. Team Team 1 Team 2 Team 3 Team 4 Team 5 Team б Team 7 Team 8 Team 9 Team 10 Yds/Att...
he National Football Leaque (NFL) records a variety of performance data for individuals and teams. To...
 he National Football Leaque (NFL) records a variety of performance data for individuals and teams. To investigate the importance of passing on the percentage of games won by a team, the following data show the conference (Cont), average number of passing yards per attempt(Yds/Att), the number of interceptions thrown per attempt (Inset), and the percentage of games _ (Wm%) for random un ple of 16 NF, tram, for a eason Team Arizona Cardinals 6.4 7.3 7.3 5.2 7,.3 8.8 6...
After reading these instructions delete all text in this shaded area. B C D E F...
 After reading these instructions delete all text in this shaded area. B C D E F G HI J Conf Yds Atin At Win% Part a. 66 0043 501 After reading these instructens delete all text in this shaded area. K XLMiner Analysis ToolPak * Team 2 Arona Cardinals NFC Anova: Single Factor Carolina Panthers NFC Anova: Two-Factor With Replication 73 60 0.033 0.027 374 56.4 AFC Use the XL Miner Analysis ToolPak to conduct Your Linear regression and After...
 The National Football League (NFL) records a variety of performance data for individuals and teams. To investigate the importance of passing on the percentage of games won by a team, the passing yards per attempt (Yds/Att), the number of interceptions thrown per attempt (Int/Att), and the percentage of games won following data show the conference (Conf), average number (Win%) for a random sample of 16 NFL teams for a season Team Conf Yds/Att Int/Att Win% Arizona Cardinals NFC 6.7 0.043...
 The National Football League (NFL) records a variety of performance data for individuals and teams. To investigate the importance of passing on the percentage of games won by a team, the data in the Excel Online file below show the conference (Conf), average number of passing yards per attempt (Yds/Att), the number of interceptions thrown per attempt (Int/Att), and the percentage of games won (Win96) for a random sample of 16 NFL teams for a season. Construct a spreadsheet to...
 The National Football League (NFL) records a variety of performance data for individuals and teams. To investigate the importance of passing on the percentage of games won by a team, the following data show the conference (Conf), average number of passing yards per attempt (Yds/Att), the number of interceptions thrown per attempt (Int/Att), and the percentage of games won (win96) for a random sample of 16 NFL teams for a season Conf NFC NFC NFC AFC NFC NFC AFC AFC...
 The National Football League (NFL) records a variety of performance data for individuals and teams. To investigate the importance of passing on the percentage of games won by a team, the data in the Excel Online file below show the conference (Conf), average number of passing yards per attempt (Yds/Att), the number of interceptions thrown per attempt (Int/Att), and the percentage of games won (Win96) for a random sample of 16 NFL teams for a season. Construct a spreadsheet to...
 The National Football League (NFL) records a variety of performance data for individuals and teams. To investigate the importance of passing on the percentage of games won by a team, the data in the Excel Online file below show the conference (Conf), average number of passing yards per attempt (Yds/Att), the number of interceptions thrown per attempt (Int/Att), and the percentage of games won (Win%) for a random sample of 16 NFL teams for a season. Construct a spreadsheet to...
 X Excel: Structured Activity- NFLPassing The National Football League (NFL) records a variety of performance data for Individuals and teams. To Investigate the importance of passing on the percentage of games won by a team, the data in the Excel Online file below show the conference (Conf), average number of passing yards per attempt (Yds/Att), the number of interceptions thrown per attempt (Int/Att), and the percentage of games won (Win %) for a random sample of 16 NFL teams for...
 The
National Football League (NFL) records a variety of performance
data for individuals and teams.
ail Sprint Wi-Fi 9:52 PM 18% Access WebAssign My Notes Previous Answers DATAfile: NFLPassing A statistical program is recommended The National Football League (NFL) records a variety of performance data for individuals and teams. To investigate the importance of passing on the percentage of games won by a team, the following data show the conference (Conf), average number of passing yards per attempt (Yds/Att), the...
The
National Football League (NFL) records a variety of performance
data for individuals and teams.
ail Sprint Wi-Fi 9:52 PM 18% Access WebAssign My Notes Previous Answers DATAfile: NFLPassing A statistical program is recommended The National Football League (NFL) records a variety of performance data for individuals and teams. To investigate the importance of passing on the percentage of games won by a team, the following data show the conference (Conf), average number of passing yards per attempt (Yds/Att), the...
 The National Football League (NFL) records a variety of performance data for Individuals and teams. To investigate the importance of passing on the percentage of games won by a team, the following data show the average number of passing yards per attempt (Yds/Att) and the percentage of games won (Win96) for a random sample of 10 NFL teams. Team Team 1 Team 2 Team 3 Team 4 Team 5 Team б Team 7 Team 8 Team 9 Team 10 Yds/Att...
 he National Football Leaque (NFL) records a variety of performance data for individuals and teams. To investigate the importance of passing on the percentage of games won by a team, the following data show the conference (Cont), average number of passing yards per attempt(Yds/Att), the number of interceptions thrown per attempt (Inset), and the percentage of games _ (Wm%) for random un ple of 16 NF, tram, for a eason Team Arizona Cardinals 6.4 7.3 7.3 5.2 7,.3 8.8 6...
 After reading these instructions delete all text in this shaded area. B C D E F G HI J Conf Yds Atin At Win% Part a. 66 0043 501 After reading these instructens delete all text in this shaded area. K XLMiner Analysis ToolPak * Team 2 Arona Cardinals NFC Anova: Single Factor Carolina Panthers NFC Anova: Two-Factor With Replication 73 60 0.033 0.027 374 56.4 AFC Use the XL Miner Analysis ToolPak to conduct Your Linear regression and After...
Most questions answered within 3 hours.
-
Write a program to prompt the user for hours and rate per hour
using input to...
asked 18 minutes ago -
Hi, please help
1)Draw two molecules that could hydrogen bond with each other.
Draw and indicate...
asked 22 minutes ago -
Using Java, I created 3 files, Pizza,PizzaOrder, and
PizzaOrder_Demo that I attached down below. But I...
asked 21 minutes ago -
a. An 8-bit successive approximation ADC has a reference voltage
of 10 V. Calculate the resolution...
asked 32 minutes ago -
The distance between the two hydrogen nuclei in the H2 molecule
is 110 pm (picometer). How...
asked 33 minutes ago -
write an article about drone effect on
construction safety.
asked 36 minutes ago -
Consider the following data for a dependent variable y and two
independent variables, x1 and x2....
asked 1 hour ago -
what is the most likely shape for a distribution with a mean of
40 and a...
asked 47 minutes ago -
The work function, Φ0 (or W0), for cesium is 3.43×10⁻¹⁹ J. The
frequency of a photon...
asked 53 minutes ago -
18.54----At the surface of Venus the average temperature is a
balmy 460 ∘C due to the...
asked 52 minutes ago -
#1. A food has been ingested. Identify all of the anatomic
structures and substructures it travels...
asked 45 minutes ago -
Grommit Engineering expects to have net income next year of $
29.71 million and free cash...
asked 54 minutes ago