

Washington Redskins 31.0 a. Develop the estimated regression equation that could be used to predict the percentage of games won given the average number of passing yards per attempt (to 1 decimal). Enter negative value as negative number Yds/Att Win% b. Develop the estimated regression equation that could be used to predict the percentage of games won given the number of interceptions thrown per attempt (to 1 decimal). Enter negative value as negative number. Win% Int/Att c. Develop the estimated regression equation that could be used to predict the percentage of games won given the average number of passing yards per attempt and the number of interceptions thrown per attempt (to 1 decimal). Enter negative value as negative number. Win% Yds/Att Int/Att + d. The average number of passing yards per attempt for the Kansas City Chiefs was 6.2 and the number of interceptions thrown per attempt was 0.036. Use the estimated regression equation developed in part (c) to predict the percentage of games won by the Kansas City Chiefs. (Note: For a season the Kansas City Chiefs' record was 7 wins and 9 losses.) Compare your prediction to the actual percentage of games won by the Kansas City Chiefs (to whole number). Actual percentage Predicted percentage -Select your answer-
Homework Answers
(a)
Here X is YDS/ATT
Y is Win %

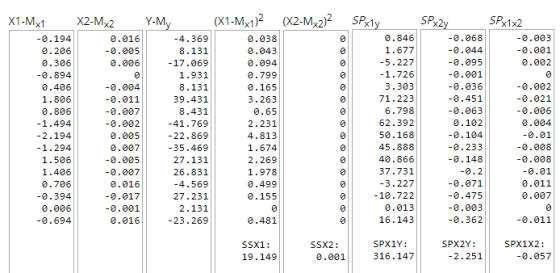
Sum of X = 110.3
Sum of Y = 868.3
Mean X = 6.8938
Mean Y = 54.2688
Sum of squares (SSX) = 19.1494
Sum of products (SP) = 316.1469
Regression Equation = ŷ = bX + a
b = SP/SSX = 316.15/19.15 =
16.50951
a = MY - bMX = 54.27 -
(16.51*6.89) = -59.54371
ŷ = 16.50951X - 59.54371
Win %= - 59.5 + (16.5)YDS/ATT
(b)
Here X is INT/ATT
Y is Win %

Sum of X = 0.439
Sum of Y = 868.3
Mean X = 0.0274
Mean Y = 54.2688
Sum of squares (SSX) = 0.0015
Sum of products (SP) = -2.2513
Regression Equation = ŷ = bX + a
b = SP/SSX = -2.25/0 =
-1548.40304
a = MY - bMX = 54.27 -
(-1548.4*0.03) = 96.75306
ŷ = -1548.40304X + 96.75306
Win% = 96.8 + (-1548.4) int/att
(c)
Here Y is Win%
X1 is yds/att
X2 is int/att
Sum of X1 = 110.3
Sum of X2 = 0.439
Sum of Y = 868.3
Mean X1 = 6.8938
Mean X2 = 0.0274
Mean Y = 54.2688
Sum of squares (SSX1) = 19.1494
Sum of squares (SSX2) = 0.0015
Sum of products (SPX1Y) = 316.1469
Sum of products (SPX2Y) = -2.2513
Sum of products (SPX1X2) = -0.057
Regression Equation = ŷ = b1X1 +
b2X2 + a
b1 =
((SPX1Y)*(SSX2)-(SPX1X2)*(SPX2Y))
/
((SSX1)*(SSX2)-(SPX1X2)*(SPX1X2))
= 0.33/0.02 = 13.474
b2 =
((SPX2Y)*(SSX1)-(SPX1X2)*(SPX1Y))
/
((SSX1)*(SSX2)-(SPX1X2)*(SPX1X2))
= -25.1/0.02 = -1020.5752
a = MY - b1MX1 -
b2MX2 = 54.27 - (13.47*6.89) -
(-1020.58*0.03) = -10.61563
win% = - 10.6 + 13.5 yds/att +
(-1020.6)int/att
(d)
win% = - 10.6 + 13.5 yds/att + (-1020.6)int/att
= - 10.6 + (13.5)(6.2) + (-1020.6)(0.036)
= -10.6 + 83.7 - 36.7416
= 36.4 %
Actual Percentage:-
Number of wins = 7
Total Matches = 7+9 = 16
So Actual Percentage = 7 / 16 = 0.4375
So 43.75%
Add Answer to:
The National Football League (NFL) records a variety of performance data for individuals and teams. To investigate the...
The National Football League (NFL) records a variety of performance data for individuals and team...
 The National Football League (NFL) records a variety of performance data for individuals and teams. To investigate the importance of passing on the percentage of games won by a team, the following data show the conference (Conf), average number of passing yards per attempt (Yds/Att), the number of interceptions thrown per attempt (Int/Att), and the percentage of games won (Win96) for a random sample of 16 NFL teams for a season Conf NFC NFC NFC AFC NFC NFC AFC AFC...
The National Football League (NFL) records a variety of performance data for individuals and teams. To investigate the importance of passing on the percentage of games won by a team, the data in the...
 The National Football League (NFL) records a variety of performance data for individuals and teams. To investigate the importance of passing on the percentage of games won by a team, the data in the Excel Online file below show the conference (Conf), average number of passing yards per attempt (Yds/Att), the number of interceptions thrown per attempt (Int/Att), and the percentage of games won (Win96) for a random sample of 16 NFL teams for a season. Construct a spreadsheet to...
The National Football League (NFL) records a variety of performance data for individuals and teams. To...
 The National Football League (NFL) records a variety of performance data for individuals and teams. To investigate the importance of passing on the percentage of games won by a team, the data in the Excel Online file below show the conference (Conf), average number of passing yards per attempt (Yds/Att), the number of interceptions thrown per attempt (Int/Att), and the percentage of games won (Win%) for a random sample of 16 NFL teams for a season. Construct a spreadsheet to...
The National Football League (NFL) records a variety of performance data for individuals and team...
 The National Football League (NFL) records a variety of performance data for individuals and teams. To investigate the importance of passing on the percentage of games won by a team, the data in the Excel Online file below show the conference (Conf), average number of passing yards per attempt (Yds/Att), the number of interceptions thrown per attempt (Int/Att), and the percentage of games won (Win96) for a random sample of 16 NFL teams for a season. Construct a spreadsheet to...
The National Football League (NFL) records a variety of performance data for individuals and teams. To investigate the importance of passing on the percentage of games won by a team, the following d...
 The National Football League (NFL) records a variety of performance data for individuals and teams. To investigate the importance of passing on the percentage of games won by a team, the following data show the conference (Conf), average number of passing yards per attempt (Yds/Att), the number of interceptions thrown per attempt (Int/Att), and the percentage of games won (win96) for a random sample of 16 NFL teams for a season Conf NFC NFC NFC AFC NFC NFC AFC AFC...
The National Football League (NFL) records a variety of performance data for individuals and teams. ail...
 The
National Football League (NFL) records a variety of performance
data for individuals and teams.
ail Sprint Wi-Fi 9:52 PM 18% Access WebAssign My Notes Previous Answers DATAfile: NFLPassing A statistical program is recommended The National Football League (NFL) records a variety of performance data for individuals and teams. To investigate the importance of passing on the percentage of games won by a team, the following data show the conference (Conf), average number of passing yards per attempt (Yds/Att), the...
The
National Football League (NFL) records a variety of performance
data for individuals and teams.
ail Sprint Wi-Fi 9:52 PM 18% Access WebAssign My Notes Previous Answers DATAfile: NFLPassing A statistical program is recommended The National Football League (NFL) records a variety of performance data for individuals and teams. To investigate the importance of passing on the percentage of games won by a team, the following data show the conference (Conf), average number of passing yards per attempt (Yds/Att), the...
X Excel: Structured Activity- NFLPassing The National Football League (NFL) records a variety of performance data...
 X Excel: Structured Activity- NFLPassing The National Football League (NFL) records a variety of performance data for Individuals and teams. To Investigate the importance of passing on the percentage of games won by a team, the data in the Excel Online file below show the conference (Conf), average number of passing yards per attempt (Yds/Att), the number of interceptions thrown per attempt (Int/Att), and the percentage of games won (Win %) for a random sample of 16 NFL teams for...
After reading these instructions delete all text in this shaded area. B C D E F...
 After reading these instructions delete all text in this shaded area. B C D E F G HI J Conf Yds Atin At Win% Part a. 66 0043 501 After reading these instructens delete all text in this shaded area. K XLMiner Analysis ToolPak * Team 2 Arona Cardinals NFC Anova: Single Factor Carolina Panthers NFC Anova: Two-Factor With Replication 73 60 0.033 0.027 374 56.4 AFC Use the XL Miner Analysis ToolPak to conduct Your Linear regression and After...
The National Football League (NFL) records a variety of performance data for Individuals and team...
 The National Football League (NFL) records a variety of performance data for Individuals and teams. To investigate the importance of passing on the percentage of games won by a team, the following data show the average number of passing yards per attempt (Yds/Att) and the percentage of games won (Win96) for a random sample of 10 NFL teams. Team Team 1 Team 2 Team 3 Team 4 Team 5 Team б Team 7 Team 8 Team 9 Team 10 Yds/Att...
he National Football Leaque (NFL) records a variety of performance data for individuals and teams. To...
 he National Football Leaque (NFL) records a variety of performance data for individuals and teams. To investigate the importance of passing on the percentage of games won by a team, the following data show the conference (Cont), average number of passing yards per attempt(Yds/Att), the number of interceptions thrown per attempt (Inset), and the percentage of games _ (Wm%) for random un ple of 16 NF, tram, for a eason Team Arizona Cardinals 6.4 7.3 7.3 5.2 7,.3 8.8 6...
 The National Football League (NFL) records a variety of performance data for individuals and teams. To investigate the importance of passing on the percentage of games won by a team, the following data show the conference (Conf), average number of passing yards per attempt (Yds/Att), the number of interceptions thrown per attempt (Int/Att), and the percentage of games won (Win96) for a random sample of 16 NFL teams for a season Conf NFC NFC NFC AFC NFC NFC AFC AFC...
 The National Football League (NFL) records a variety of performance data for individuals and teams. To investigate the importance of passing on the percentage of games won by a team, the data in the Excel Online file below show the conference (Conf), average number of passing yards per attempt (Yds/Att), the number of interceptions thrown per attempt (Int/Att), and the percentage of games won (Win96) for a random sample of 16 NFL teams for a season. Construct a spreadsheet to...
 The National Football League (NFL) records a variety of performance data for individuals and teams. To investigate the importance of passing on the percentage of games won by a team, the data in the Excel Online file below show the conference (Conf), average number of passing yards per attempt (Yds/Att), the number of interceptions thrown per attempt (Int/Att), and the percentage of games won (Win%) for a random sample of 16 NFL teams for a season. Construct a spreadsheet to...
 The National Football League (NFL) records a variety of performance data for individuals and teams. To investigate the importance of passing on the percentage of games won by a team, the data in the Excel Online file below show the conference (Conf), average number of passing yards per attempt (Yds/Att), the number of interceptions thrown per attempt (Int/Att), and the percentage of games won (Win96) for a random sample of 16 NFL teams for a season. Construct a spreadsheet to...
 The National Football League (NFL) records a variety of performance data for individuals and teams. To investigate the importance of passing on the percentage of games won by a team, the following data show the conference (Conf), average number of passing yards per attempt (Yds/Att), the number of interceptions thrown per attempt (Int/Att), and the percentage of games won (win96) for a random sample of 16 NFL teams for a season Conf NFC NFC NFC AFC NFC NFC AFC AFC...
 The
National Football League (NFL) records a variety of performance
data for individuals and teams.
ail Sprint Wi-Fi 9:52 PM 18% Access WebAssign My Notes Previous Answers DATAfile: NFLPassing A statistical program is recommended The National Football League (NFL) records a variety of performance data for individuals and teams. To investigate the importance of passing on the percentage of games won by a team, the following data show the conference (Conf), average number of passing yards per attempt (Yds/Att), the...
The
National Football League (NFL) records a variety of performance
data for individuals and teams.
ail Sprint Wi-Fi 9:52 PM 18% Access WebAssign My Notes Previous Answers DATAfile: NFLPassing A statistical program is recommended The National Football League (NFL) records a variety of performance data for individuals and teams. To investigate the importance of passing on the percentage of games won by a team, the following data show the conference (Conf), average number of passing yards per attempt (Yds/Att), the...
 X Excel: Structured Activity- NFLPassing The National Football League (NFL) records a variety of performance data for Individuals and teams. To Investigate the importance of passing on the percentage of games won by a team, the data in the Excel Online file below show the conference (Conf), average number of passing yards per attempt (Yds/Att), the number of interceptions thrown per attempt (Int/Att), and the percentage of games won (Win %) for a random sample of 16 NFL teams for...
 After reading these instructions delete all text in this shaded area. B C D E F G HI J Conf Yds Atin At Win% Part a. 66 0043 501 After reading these instructens delete all text in this shaded area. K XLMiner Analysis ToolPak * Team 2 Arona Cardinals NFC Anova: Single Factor Carolina Panthers NFC Anova: Two-Factor With Replication 73 60 0.033 0.027 374 56.4 AFC Use the XL Miner Analysis ToolPak to conduct Your Linear regression and After...
 The National Football League (NFL) records a variety of performance data for Individuals and teams. To investigate the importance of passing on the percentage of games won by a team, the following data show the average number of passing yards per attempt (Yds/Att) and the percentage of games won (Win96) for a random sample of 10 NFL teams. Team Team 1 Team 2 Team 3 Team 4 Team 5 Team б Team 7 Team 8 Team 9 Team 10 Yds/Att...
 he National Football Leaque (NFL) records a variety of performance data for individuals and teams. To investigate the importance of passing on the percentage of games won by a team, the following data show the conference (Cont), average number of passing yards per attempt(Yds/Att), the number of interceptions thrown per attempt (Inset), and the percentage of games _ (Wm%) for random un ple of 16 NF, tram, for a eason Team Arizona Cardinals 6.4 7.3 7.3 5.2 7,.3 8.8 6...
Most questions answered within 3 hours.
-
The titanic hit an iceberg estimated to be half of her mass.
Before hitting the iceberg,...
asked 16 minutes ago -
3. The top four firms in Industry A have market shares of 30,
25, 10, and...
asked 19 minutes ago -
Are there such things as microscopic multicellular animal
parasites? If so, please give examples.
asked 53 minutes ago -
1. What two structures in the ear are involved in your
sense of balance and in...
asked 40 minutes ago -
Two ice skaters suddenly push off against one another starting
from a stationary position. The 45...
asked 41 minutes ago -
What is the Larmor frequency for a proton in a magnetic field of
B0 = 14.0...
asked 42 minutes ago -
Problem 03.019 Annual Worth Calculations
Find the value of x that makes the equivalent annual
worth...
asked 58 minutes ago -
Under common law, right of survivorship was automatically a
feature of which type of co-tenancy?
a....
asked 54 minutes ago -
At 1 bar, how much energy is required to heat 61.0 g of H2O(s)
at −12.0...
asked 1 hour ago -
Find the mixed-strategy equilibrium to the Battle of the sexes
game in Figure 5.1 below
Hockey...
asked 1 hour ago -
Use the following information to answer the next three
questions.
QUESTION 5
As of today, the...
asked 1 hour ago -
Using the specific identification method: Date Units purchased
Cost per unit Ending inventory March 1 15...
asked 1 hour ago