Researchers are studying the effect of tilling(no-till vs. traditional tilling) on the production of corn yield...
Researchers are studying the effect of tilling(no-till vs. traditional tilling) on the production of corn yield . They formulated the following research question. Does yield tend to be lower on no-tilled plots than on traditionally-tilled plots?
In the study, they divided up fields on 20 different farms into equal sized plots. One plot on each farm was farmed with conventional tilling methods for 5 years, whereas the other plot was farmed with not-till methods for the same five year period. In the final year, they measured the yield (tons/acre) of corn on each of the 40 plots. Assume that population differences are normally distributed.
Here is the R output:
Paired t-test
data: notill and traditional
t = 2.3803, df = 19, p-value = 0.02793
alternative hypothesis: true difference in means is not equal to 0
95 percent confidence interval:
1.966947 30.633053
sample estimates:
mean of the differences
16.3
part a) Test the research question at the 5% level of significance.
part b) State and interpret the 95% confidence interval for the difference in population means.
Homework Answers

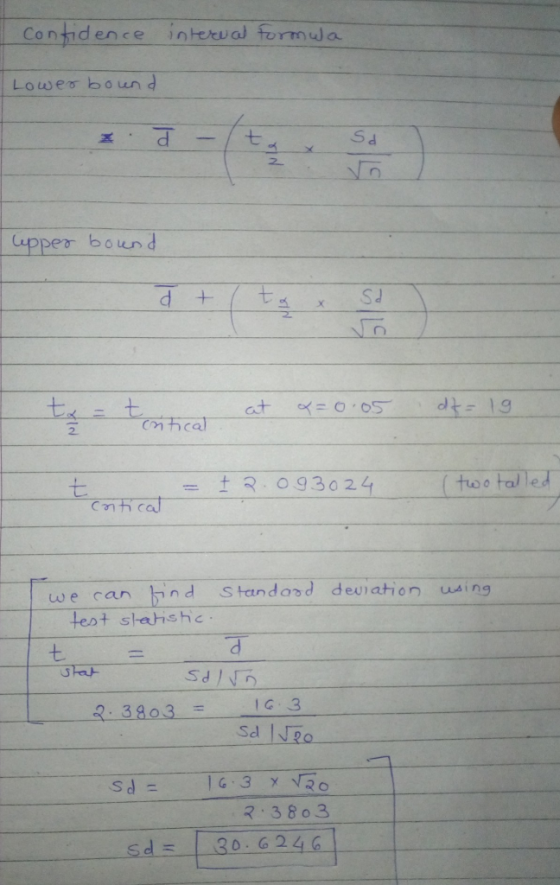
Note :
Standard deviation is not provided
But we can find using given output
Test statistic , mean difference and sample is given
So standard deviation is 30.6246
By using this standard deviation all answers are coming true.
Confidence interval is also correct by putting SD= 30.6246.
Add Answer to:
Researchers are studying the effect of tilling(no-till vs.
traditional tilling) on the production of corn yield...
Crop researchers plant 34 plots with a new variety of corn. The average yield in bushels...
Crop researchers plant 34 plots with a new variety of corn. The average yield in bushels per acre is 123.33. (Assume SD= 15) a. What is the shape of the sampling distribution of x (dash above x)? Explain. b. Find the 90% confidence interval for the mean yield (the mew symbol) for this variety of corn. c. Find the 95% confidence interval. d. Find the 99% confidence interval. e. How do the margins of error change as the confidence level...
The data below are yields for two different types of corn seed that were used on...
The data below are yields for two different types of corn seed that were used on adjacent plots of land. Assume that the data are simple random samples and that the differences have a distribution that is approximately normal. Construct a 95% confidence interval estimate of the difference between type 1 and type 2 yields. What does the confidence interval suggest about farmer Joe's claim that type 1 seed is better than type 2 seed? Type_1 Type_2 2097 2008 2079 ...
The data below are yields for two different types of corn seed that were used on...
 The data below are yields for two different types of corn seed that were used on adjacent plots of land. Assume that the data are simple random samples and that the differences have a distribution that is approximately normal. Construct a 95% confidence interval estimate of the difference between type 1 and type 2 yields. What does the confidence interval suggest about farmer Joe's claim that type 1 seed is better than type 2 seed? Type 1 2029 1968 2120...
2. An experiment was conducted to test the effects of nitrogen fertilizer on lettuce production. Five...
2. An experiment was conducted to test the effects of nitrogen fertilizer on lettuce production. Five rates of ammonium nitrate were applied to four replicate plots in a completely randomized design. The data are the number of heads of lettuce harvested from the plot. Treatment (lb N/acre) Head of lecture/plot 0 104 114 90 140 50 134 130 144 174 100 146 142 152 156 150 147 160 160 163 200 131 148 154 163 Write the linear statistical model...
5. The active ingredient of a particular kind of drug tablet has traditionally been measured by...
 5. The active ingredient of a particular kind of drug tablet has traditionally been measured by method A. A cheaper and quicker method B has been developed but its reliability has to be tested against method A. Each of 10 tablets is divided into two halves and the amount of active ingredient (in milligrams) is measured, one half-tablet by method A and the other by method B. The results are given below. Tablet Method A Method B Difference 97.2 97.2...
5. Given below are descriptive statistics, as well as boxplots, of the moisture content (by percent)...
 5. Given below are descriptive statistics, as well as boxplots, of the moisture content (by percent) for random samples of different fruits and vegetables, probability plots for the two variables, and output from the test of equality of population means. Descriptive Statistics: Fruits, Vegetables Statistics Variable N N Mean SE Mean StDer Minimum Q1 Median 03 Maximum Fruits 3 O 82.88 244 690 7200 76.00 85.00 87.75 92.00 Vegetables 9 0 9167 125 374 85.00 88.50 92.00 95.00 96.00 Boxplot...
_______________________________________________________________________________________________________________________________ ______________________________________________________________________________________________________ ____________________
 _______________________________________________________________________________________________________________________________
______________________________________________________________________________________________________
_______________________________________________________________________________________________________________________________________
Which of the following statements are true concerning the mean of the differences between two dependent samples (matched pairs)? Select all that apply. A. The requirement of a simple random sample is satisfied if we have independent pairs of convenience sampling data. B. The methods used to evaluate the mean of the differences between two dependent variables apply if one has 34 IQ scores of workers from California and 34 IQ scores of workers from Texas. C....
_______________________________________________________________________________________________________________________________
______________________________________________________________________________________________________
_______________________________________________________________________________________________________________________________________
Which of the following statements are true concerning the mean of the differences between two dependent samples (matched pairs)? Select all that apply. A. The requirement of a simple random sample is satisfied if we have independent pairs of convenience sampling data. B. The methods used to evaluate the mean of the differences between two dependent variables apply if one has 34 IQ scores of workers from California and 34 IQ scores of workers from Texas. C....
?The traditional retail store audit is one of the most widely used marketing research tools among...
 ?The traditional retail store audit is one of the most widely
used marketing research tools among consumer
package goods companies. It involves periodic audits of a sample of
retail audits to monitor inventory and
purchases of a particular product. A study was conducted to compare
market share data yielded by retail
store audits with two alternative, less costly auditing procedures
– weekend selldown audits and store
purchases audits. The market shares of six major brands of beer
distributed in eastern...
?The traditional retail store audit is one of the most widely
used marketing research tools among consumer
package goods companies. It involves periodic audits of a sample of
retail audits to monitor inventory and
purchases of a particular product. A study was conducted to compare
market share data yielded by retail
store audits with two alternative, less costly auditing procedures
– weekend selldown audits and store
purchases audits. The market shares of six major brands of beer
distributed in eastern...
All the exercises, pls. MULTIPLE CHOICE. Choose the one alternative that best completes the statement or...
 All the exercises, pls.
MULTIPLE CHOICE. Choose the one alternative that best completes the statement or answers the question Assume that you want to test the claim that the paired sample data come from a population for which the mean difference is d - 0. Compute the value of the t test statistic. Round intermediate calculations to four decimal places as needed and final answers to three decimal places as needed. 11 X 9 6 7 5 12 y 6...
All the exercises, pls.
MULTIPLE CHOICE. Choose the one alternative that best completes the statement or answers the question Assume that you want to test the claim that the paired sample data come from a population for which the mean difference is d - 0. Compute the value of the t test statistic. Round intermediate calculations to four decimal places as needed and final answers to three decimal places as needed. 11 X 9 6 7 5 12 y 6...
2. 16 alkaline and 16 heavy-duty Radio shack batteries were placed individually in a cir- cuit...
 2. 16 alkaline and 16 heavy-duty Radio shack batteries were placed individually in a cir- cuit consisting of two flashlight bulbs wired in parallel, a switch, a battery holder, and a Hewlet Packard 427-A analog DC voltmetre. Each battery was drained to a reference failure voltage of 0.9 volts and the time to failure (min) was measured. Alkaline Heavy-duty 15 29 31 17 22 22 18 27 30 26 33 18 17 22 15 16 23 23 29 27 26...
 The data below are yields for two different types of corn seed that were used on adjacent plots of land. Assume that the data are simple random samples and that the differences have a distribution that is approximately normal. Construct a 95% confidence interval estimate of the difference between type 1 and type 2 yields. What does the confidence interval suggest about farmer Joe's claim that type 1 seed is better than type 2 seed? Type 1 2029 1968 2120...
 5. The active ingredient of a particular kind of drug tablet has traditionally been measured by method A. A cheaper and quicker method B has been developed but its reliability has to be tested against method A. Each of 10 tablets is divided into two halves and the amount of active ingredient (in milligrams) is measured, one half-tablet by method A and the other by method B. The results are given below. Tablet Method A Method B Difference 97.2 97.2...
 5. Given below are descriptive statistics, as well as boxplots, of the moisture content (by percent) for random samples of different fruits and vegetables, probability plots for the two variables, and output from the test of equality of population means. Descriptive Statistics: Fruits, Vegetables Statistics Variable N N Mean SE Mean StDer Minimum Q1 Median 03 Maximum Fruits 3 O 82.88 244 690 7200 76.00 85.00 87.75 92.00 Vegetables 9 0 9167 125 374 85.00 88.50 92.00 95.00 96.00 Boxplot...
 _______________________________________________________________________________________________________________________________
______________________________________________________________________________________________________
_______________________________________________________________________________________________________________________________________
Which of the following statements are true concerning the mean of the differences between two dependent samples (matched pairs)? Select all that apply. A. The requirement of a simple random sample is satisfied if we have independent pairs of convenience sampling data. B. The methods used to evaluate the mean of the differences between two dependent variables apply if one has 34 IQ scores of workers from California and 34 IQ scores of workers from Texas. C....
_______________________________________________________________________________________________________________________________
______________________________________________________________________________________________________
_______________________________________________________________________________________________________________________________________
Which of the following statements are true concerning the mean of the differences between two dependent samples (matched pairs)? Select all that apply. A. The requirement of a simple random sample is satisfied if we have independent pairs of convenience sampling data. B. The methods used to evaluate the mean of the differences between two dependent variables apply if one has 34 IQ scores of workers from California and 34 IQ scores of workers from Texas. C....
 ?The traditional retail store audit is one of the most widely
used marketing research tools among consumer
package goods companies. It involves periodic audits of a sample of
retail audits to monitor inventory and
purchases of a particular product. A study was conducted to compare
market share data yielded by retail
store audits with two alternative, less costly auditing procedures
– weekend selldown audits and store
purchases audits. The market shares of six major brands of beer
distributed in eastern...
?The traditional retail store audit is one of the most widely
used marketing research tools among consumer
package goods companies. It involves periodic audits of a sample of
retail audits to monitor inventory and
purchases of a particular product. A study was conducted to compare
market share data yielded by retail
store audits with two alternative, less costly auditing procedures
– weekend selldown audits and store
purchases audits. The market shares of six major brands of beer
distributed in eastern...
 All the exercises, pls.
MULTIPLE CHOICE. Choose the one alternative that best completes the statement or answers the question Assume that you want to test the claim that the paired sample data come from a population for which the mean difference is d - 0. Compute the value of the t test statistic. Round intermediate calculations to four decimal places as needed and final answers to three decimal places as needed. 11 X 9 6 7 5 12 y 6...
All the exercises, pls.
MULTIPLE CHOICE. Choose the one alternative that best completes the statement or answers the question Assume that you want to test the claim that the paired sample data come from a population for which the mean difference is d - 0. Compute the value of the t test statistic. Round intermediate calculations to four decimal places as needed and final answers to three decimal places as needed. 11 X 9 6 7 5 12 y 6...
 2. 16 alkaline and 16 heavy-duty Radio shack batteries were placed individually in a cir- cuit consisting of two flashlight bulbs wired in parallel, a switch, a battery holder, and a Hewlet Packard 427-A analog DC voltmetre. Each battery was drained to a reference failure voltage of 0.9 volts and the time to failure (min) was measured. Alkaline Heavy-duty 15 29 31 17 22 22 18 27 30 26 33 18 17 22 15 16 23 23 29 27 26...
Most questions answered within 3 hours.
-
The pH of a sample of water from a river is 5.0. A
sample of effluent from...
asked 8 minutes ago -
At the beginning of the period, the Fabricating Department
budgeted direct labor of $136,500 and equipment...
asked 35 minutes ago -
Please answer all
____ 28. Rent control is usually
justified on the grounds that it protects...
asked 35 minutes ago -
PARTS A-D HAVE BEEN ANSWERED. WAS TOLD TO REPOST. ONLY ANSWER
PARTS E and F.
A...
asked 52 minutes ago -
2) You are given the task of finding a representation for a
circle in a drawing...
asked 2 hours ago -
STUDY QUESTION: Does use of diet drug fen-phen
(fenfluramine-phentermine) cause valvular heart disease?
HINT: Valvular heart...
asked 1 hour ago -
1. An object weighing 40 N rests on a surface. The coefficient
of friction is 0.35....
asked 3 hours ago -
Investor company owns 35% of investee company voting stock and
accounts for the investment under the...
asked 4 hours ago -
The number of major faults on a randomly chosen 1 km stretch of
highway has a...
asked 4 hours ago -
Consider the competitive environment of Starbuck's, Progressive
Insurance, a manufacturing firm with low turnover, or a...
asked 5 hours ago -
3. Gains from trade
Consider two neighbouring island countries called Euphoria and
Contente. They each have...
asked 7 hours ago -
A business executive has the option to invest money in two
plans: Plan A guarantees that...
asked 9 hours ago