
Homework Answers
Add Answer to:
Click on the icon to read the news clip, then complete the following steps. The graph...
Please indicate the correct answer and explain why. Graph with labels as instructed(which one is one...
 Please indicate the correct answer and explain why. Graph with
labels as instructed(which one is one 1,2,mr1)
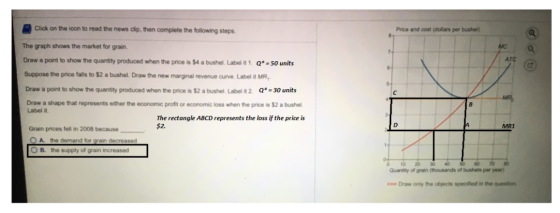
Click on the icon to read the news clip, then complete the following steps Price and cost (dollars per bushel) MC The graph shows the market for grain. Draw a point to show the quantity produced when the price is $4 a bushel. Label it 1 Suppose the price falls to $2 a bushel. Draw the new marginal revenue curve. Label it MR....
Please indicate the correct answer and explain why. Graph with
labels as instructed(which one is one 1,2,mr1)
Click on the icon to read the news clip, then complete the following steps Price and cost (dollars per bushel) MC The graph shows the market for grain. Draw a point to show the quantity produced when the price is $4 a bushel. Label it 1 Suppose the price falls to $2 a bushel. Draw the new marginal revenue curve. Label it MR....
Please answer both questions Revenue and cost (dolurs per unit) 50 40 30 20 10 MC...
 Please answer both questions
Revenue and cost (dolurs per unit) 50 40 30 20 10 MC ATC 0 20 0 40S0 Output (units per day) The figure above shows a perfectly competitive firm. If the market price is S20 per unit, then the firm producesunits and has an economic profit that is O A. 30; more than $100 B. more than 30; more than $100 O C. 20; less than $400 D. 30; zero because the firm earns a normal...
Please answer both questions
Revenue and cost (dolurs per unit) 50 40 30 20 10 MC ATC 0 20 0 40S0 Output (units per day) The figure above shows a perfectly competitive firm. If the market price is S20 per unit, then the firm producesunits and has an economic profit that is O A. 30; more than $100 B. more than 30; more than $100 O C. 20; less than $400 D. 30; zero because the firm earns a normal...
Click on the icon to read the news clip, then use this information to complete the...
 Click on the icon to read the news clip, then use this information to complete the following steps. In the left graph 1 Use the line tool to draw the market demand and supply curves in 2016. Label the curves. 2. The market equilibrium is 5 million gallons and the price is $50 a gallon Use the point tool to draw the market equilibrium and label it In the right graph Price (dollars per gallon) 30 85 Price and cost...
Click on the icon to read the news cip, then complete the Price and coet (dollans...
 Click on the icon to read the news cip, then complete the Price and coet (dollans per galon) following steps. As a result of the drop in Canadian production, the price of maple synup The graph shows the revenue and cost curves for an individual ATC producer in the maple syrup industry Draw the marginal revenue curve if the price of maple syrup rises to $40 a gallon. Label it MR1 MPo Draw a point to show the new equilibrium...
Please graph clearly with labels!!! Thank you! Tennessee Subway Corporation is a natural monopoly. The graph...
 Please graph clearly with labels!!! Thank
you!
Tennessee Subway Corporation is a natural monopoly. The graph shows the market demand curve and the firm's marginal cost curve. The monopoly is unregulated and maximizes profit. Price and cost (dollars per month) Draw the firm's marginal revenue curve. Label it MR. Draw a point at the profit-maximizing price and quantity. Label it 1 The monopoly makes a positive economic profit. Draw the firm's average total cost curve. Label it ATC. Draw a...
Please graph clearly with labels!!! Thank
you!
Tennessee Subway Corporation is a natural monopoly. The graph shows the market demand curve and the firm's marginal cost curve. The monopoly is unregulated and maximizes profit. Price and cost (dollars per month) Draw the firm's marginal revenue curve. Label it MR. Draw a point at the profit-maximizing price and quantity. Label it 1 The monopoly makes a positive economic profit. Draw the firm's average total cost curve. Label it ATC. Draw a...
Click on the icon to read the news clip, then answer the following questions Price (dollars...
 Click on the icon to read the news clip, then answer the following questions Price (dollars per copy) 80 The graph shows the market for Microsoft Windows >The graph il plot data needed to answer this question. 720 640 560 48 40 32 240 16 If the marginal cost of making a copy of the full version of Windows that includes Interned Explorer (IE) is zero, Microsoft will set the price of Windows at $ per copy If the average...
Click on the icon to read the news dip, then answer the following questions Price bollars...
 Click on the icon to read the news dip, then answer the following questions Price bollars per gallon) The graph shows the market for milk in Venezuela when a price control is in effect Draw a shape that represents: 1) consumer surplus Labelit CS 2) producer surplus, Labelit PS, 3) the deadweight loss. Label DWL. Also draw a shape that show the resources lost from time spend in line Labelit Loss Moving from a milk market with no price controls...
Click on the icon to study the Economics in the News article. Then answer the following...
 Click on the icon to study the Economics in the News article. Then answer the following questions. Price level (GDP deflator, 2007=100) 120- LAS16 SAS16 3. The graph illustrates the economy in the first quarter of 2016. Show how aggregate demand and aggregate supply changed in 2016 and 2017. o os In the first quarter of 2017, potential GDP was $1,835 billion. Real GDP was $1,830 billion and the price level was 116. Draw and label curves to show how...
Graph clearly with labels as instructed please. Indicate the right answer Thank you The graph shows...
 Graph clearly with labels as instructed please. Indicate the
right answer Thank you
The graph shows the demand curve, marginal revenue curve, and marginal cost curve of Big Splash, Inc., a producer of wading pools in monopolistic competition. Draw a point at the firm's profit-maximizing price and quantity. Draw a vertical arrow that shows the firm's markup. Draw a shape that shows the firm's economic profit. Price and cost (dollars per pool) MC 2804 260 ATC Big Splash's markup is...
Graph clearly with labels as instructed please. Indicate the
right answer Thank you
The graph shows the demand curve, marginal revenue curve, and marginal cost curve of Big Splash, Inc., a producer of wading pools in monopolistic competition. Draw a point at the firm's profit-maximizing price and quantity. Draw a vertical arrow that shows the firm's markup. Draw a shape that shows the firm's economic profit. Price and cost (dollars per pool) MC 2804 260 ATC Big Splash's markup is...
Please graph clearly with labels and follow the instruction. Indicate the correct answer and explain why....
 Please graph clearly with labels and follow the instruction.
Indicate the correct answer and explain why. Thank you!
The graph shows the demand curve, marginal revenue curve, and marginal cost curve of Walk Fit, Inc., a producer of hiking boots in monopolistic competition Draw a point at the firm's profit-maximizing price and quantity. Draw a vertical arrow that shows the firm's markup Draw a shape that shows the firm's economic profit Price and cost(dollars per pair) MC ATC Walk Fits...
Please graph clearly with labels and follow the instruction.
Indicate the correct answer and explain why. Thank you!
The graph shows the demand curve, marginal revenue curve, and marginal cost curve of Walk Fit, Inc., a producer of hiking boots in monopolistic competition Draw a point at the firm's profit-maximizing price and quantity. Draw a vertical arrow that shows the firm's markup Draw a shape that shows the firm's economic profit Price and cost(dollars per pair) MC ATC Walk Fits...
 Please indicate the correct answer and explain why. Graph with
labels as instructed(which one is one 1,2,mr1)
Click on the icon to read the news clip, then complete the following steps Price and cost (dollars per bushel) MC The graph shows the market for grain. Draw a point to show the quantity produced when the price is $4 a bushel. Label it 1 Suppose the price falls to $2 a bushel. Draw the new marginal revenue curve. Label it MR....
Please indicate the correct answer and explain why. Graph with
labels as instructed(which one is one 1,2,mr1)
Click on the icon to read the news clip, then complete the following steps Price and cost (dollars per bushel) MC The graph shows the market for grain. Draw a point to show the quantity produced when the price is $4 a bushel. Label it 1 Suppose the price falls to $2 a bushel. Draw the new marginal revenue curve. Label it MR....
 Please answer both questions
Revenue and cost (dolurs per unit) 50 40 30 20 10 MC ATC 0 20 0 40S0 Output (units per day) The figure above shows a perfectly competitive firm. If the market price is S20 per unit, then the firm producesunits and has an economic profit that is O A. 30; more than $100 B. more than 30; more than $100 O C. 20; less than $400 D. 30; zero because the firm earns a normal...
Please answer both questions
Revenue and cost (dolurs per unit) 50 40 30 20 10 MC ATC 0 20 0 40S0 Output (units per day) The figure above shows a perfectly competitive firm. If the market price is S20 per unit, then the firm producesunits and has an economic profit that is O A. 30; more than $100 B. more than 30; more than $100 O C. 20; less than $400 D. 30; zero because the firm earns a normal...
 Click on the icon to read the news clip, then use this information to complete the following steps. In the left graph 1 Use the line tool to draw the market demand and supply curves in 2016. Label the curves. 2. The market equilibrium is 5 million gallons and the price is $50 a gallon Use the point tool to draw the market equilibrium and label it In the right graph Price (dollars per gallon) 30 85 Price and cost...
 Click on the icon to read the news cip, then complete the Price and coet (dollans per galon) following steps. As a result of the drop in Canadian production, the price of maple synup The graph shows the revenue and cost curves for an individual ATC producer in the maple syrup industry Draw the marginal revenue curve if the price of maple syrup rises to $40 a gallon. Label it MR1 MPo Draw a point to show the new equilibrium...
 Please graph clearly with labels!!! Thank
you!
Tennessee Subway Corporation is a natural monopoly. The graph shows the market demand curve and the firm's marginal cost curve. The monopoly is unregulated and maximizes profit. Price and cost (dollars per month) Draw the firm's marginal revenue curve. Label it MR. Draw a point at the profit-maximizing price and quantity. Label it 1 The monopoly makes a positive economic profit. Draw the firm's average total cost curve. Label it ATC. Draw a...
Please graph clearly with labels!!! Thank
you!
Tennessee Subway Corporation is a natural monopoly. The graph shows the market demand curve and the firm's marginal cost curve. The monopoly is unregulated and maximizes profit. Price and cost (dollars per month) Draw the firm's marginal revenue curve. Label it MR. Draw a point at the profit-maximizing price and quantity. Label it 1 The monopoly makes a positive economic profit. Draw the firm's average total cost curve. Label it ATC. Draw a...
 Click on the icon to read the news clip, then answer the following questions Price (dollars per copy) 80 The graph shows the market for Microsoft Windows >The graph il plot data needed to answer this question. 720 640 560 48 40 32 240 16 If the marginal cost of making a copy of the full version of Windows that includes Interned Explorer (IE) is zero, Microsoft will set the price of Windows at $ per copy If the average...
 Click on the icon to read the news dip, then answer the following questions Price bollars per gallon) The graph shows the market for milk in Venezuela when a price control is in effect Draw a shape that represents: 1) consumer surplus Labelit CS 2) producer surplus, Labelit PS, 3) the deadweight loss. Label DWL. Also draw a shape that show the resources lost from time spend in line Labelit Loss Moving from a milk market with no price controls...
 Click on the icon to study the Economics in the News article. Then answer the following questions. Price level (GDP deflator, 2007=100) 120- LAS16 SAS16 3. The graph illustrates the economy in the first quarter of 2016. Show how aggregate demand and aggregate supply changed in 2016 and 2017. o os In the first quarter of 2017, potential GDP was $1,835 billion. Real GDP was $1,830 billion and the price level was 116. Draw and label curves to show how...
 Graph clearly with labels as instructed please. Indicate the
right answer Thank you
The graph shows the demand curve, marginal revenue curve, and marginal cost curve of Big Splash, Inc., a producer of wading pools in monopolistic competition. Draw a point at the firm's profit-maximizing price and quantity. Draw a vertical arrow that shows the firm's markup. Draw a shape that shows the firm's economic profit. Price and cost (dollars per pool) MC 2804 260 ATC Big Splash's markup is...
Graph clearly with labels as instructed please. Indicate the
right answer Thank you
The graph shows the demand curve, marginal revenue curve, and marginal cost curve of Big Splash, Inc., a producer of wading pools in monopolistic competition. Draw a point at the firm's profit-maximizing price and quantity. Draw a vertical arrow that shows the firm's markup. Draw a shape that shows the firm's economic profit. Price and cost (dollars per pool) MC 2804 260 ATC Big Splash's markup is...
 Please graph clearly with labels and follow the instruction.
Indicate the correct answer and explain why. Thank you!
The graph shows the demand curve, marginal revenue curve, and marginal cost curve of Walk Fit, Inc., a producer of hiking boots in monopolistic competition Draw a point at the firm's profit-maximizing price and quantity. Draw a vertical arrow that shows the firm's markup Draw a shape that shows the firm's economic profit Price and cost(dollars per pair) MC ATC Walk Fits...
Please graph clearly with labels and follow the instruction.
Indicate the correct answer and explain why. Thank you!
The graph shows the demand curve, marginal revenue curve, and marginal cost curve of Walk Fit, Inc., a producer of hiking boots in monopolistic competition Draw a point at the firm's profit-maximizing price and quantity. Draw a vertical arrow that shows the firm's markup Draw a shape that shows the firm's economic profit Price and cost(dollars per pair) MC ATC Walk Fits...
Most questions answered within 3 hours.
-
The pH of a sample of water from a river is 5.0. A
sample of effluent from...
asked 38 minutes ago -
At the beginning of the period, the Fabricating Department
budgeted direct labor of $136,500 and equipment...
asked 1 hour ago -
Please answer all
____ 28. Rent control is usually
justified on the grounds that it protects...
asked 1 hour ago -
PARTS A-D HAVE BEEN ANSWERED. WAS TOLD TO REPOST. ONLY ANSWER
PARTS E and F.
A...
asked 1 hour ago -
2) You are given the task of finding a representation for a
circle in a drawing...
asked 2 hours ago -
STUDY QUESTION: Does use of diet drug fen-phen
(fenfluramine-phentermine) cause valvular heart disease?
HINT: Valvular heart...
asked 2 hours ago -
1. An object weighing 40 N rests on a surface. The coefficient
of friction is 0.35....
asked 3 hours ago -
Investor company owns 35% of investee company voting stock and
accounts for the investment under the...
asked 4 hours ago -
The number of major faults on a randomly chosen 1 km stretch of
highway has a...
asked 5 hours ago -
Consider the competitive environment of Starbuck's, Progressive
Insurance, a manufacturing firm with low turnover, or a...
asked 5 hours ago -
3. Gains from trade
Consider two neighbouring island countries called Euphoria and
Contente. They each have...
asked 7 hours ago -
A business executive has the option to invest money in two
plans: Plan A guarantees that...
asked 10 hours ago