


*Both curves have not been adjusted, they are in the state that the question gave me.*
Updated Demand Curves:


Homework Answers

Add Answer to:
*Both curves have not been adjusted, they are in the state that
the question gave me.*...
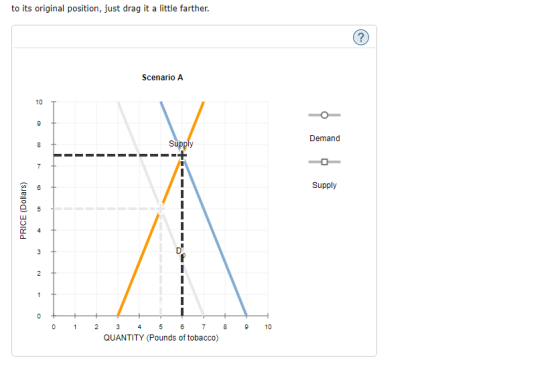
sometimes the exports of developing nations are concentrated in only one or few primary products. for...
 sometimes the exports of developing nations are concentrated in
only one or few primary products. for example world bank data,
tobacco consists 50% of Malawi's total exports. Therefore, changes
in demand or supply of tobacco can have significant effects on the
health of Malawi's economy
The current world price of tobacco is $5.00 per pound, but
there is uncertainty about the shape of the demand and supply
curves. Tbe following graphs (scenario A and Scenario B) show two
possiblilities for...
sometimes the exports of developing nations are concentrated in
only one or few primary products. for example world bank data,
tobacco consists 50% of Malawi's total exports. Therefore, changes
in demand or supply of tobacco can have significant effects on the
health of Malawi's economy
The current world price of tobacco is $5.00 per pound, but
there is uncertainty about the shape of the demand and supply
curves. Tbe following graphs (scenario A and Scenario B) show two
possiblilities for...
4. Shifting curves and the importance of elasticity Consider the market for umbrellas. Suppose the quantity...
 4. Shifting curves and the importance of elasticity Consider the market for umbrellas. Suppose the quantity of umbrellas demanded by consumers (D) depends on the price of an umbrella (P) and the percentage chance of rain (R) forecasted by the local news station. Similarly, the quantity of umbrellas supplied by producers (Qs) depends on the price of an umbrella (P) and the square-foot price of waterproof nylon (N) used in the production of umbrellas. The following two graphs depict the...
7. Using the bond-market diagram below, drag the bond demand or bond supply curves (or both)...
 7. Using the bond-market diagram below, drag the bond demand or bond supply curves (or both) to illustrate how an increass bond risk affects equilibrium bond price and quantity. Assume that investors are risk-averse Tool tip: Click and drag one or both of back to its original position. just try again and drag it a little farther. When you are satishied with your answer, click the Submit Answer button. the curves. Curves will snap into position, so if you try...
8. Short-run and long-run effects of a shift in demand Aa Aa Suppose that the chicken...
 8. Short-run and long-run effects of a shift in demand Aa Aa Suppose that the chicken industry is in long-run equilibrium at a price of $3 per pound of chicken and a quantity of 600 million pounds per year. Suppose the Surgeon General issues a report saying that eating chicken is good for your health. The Surgeon General's report will cause consumers to demand chicken at every price. In the short run, firms will respond by Shift the supply curve,...
8. A supply and demand puzzle The following graph shows the market for roses in 2010....
8. A supply and demand puzzle The following graph shows the market for roses in 2010. Between 2010 and 2011, the equilibrium quantity of roses remained constant, but the equilibrium price of roses increased. From this, you can conclude that between 2010 and 2011, the supply of roses _______ and the demand for roses _______ .Adjust the graph to illustrate your answer by showing the positions of the supply and demand curves in 2011. Note: Select and drag one or both of...
The following graph shows the market for cars in 2008. Between 2008 and 2009, the equilibrium price of cars remained constant
 The following graph shows the market for cars in 2008. Between 2008 and 2009, the equilibrium price of cars remained constant, but the equilibrium quantity of cars decreased. From this, you can conclude that between 2008 and 2009, the supply of cars _______ and the demand for cars _______ .Adjust the graph to illustrate your answer by showing the positions of the supply and demand curves in 2009. Note: Select and drag one or both of the curves to the desired...
The following graph shows the market for cars in 2010
 The following graph shows the market for cars in 2010 . Between 2010 and 2011, the equilibrium price of cars remained constant, but the equilibrium quantity of cars decreased. From this, you can conclude that between 2010 and 2011, the supply of cars _______ and the demand for cars _______ .Adjust the graph to illustrate your answer by showing the positions of the supply and demand curves in 2011.Note: Select and drag one or both of the curves to the...
The following graph shows the market for roses in 2007
 A supply and demand puzzleThe following graph shows the market for roses in 2007 . Between 2007 and 2008 , the equilibrium quantity of roses remained constant, but the equilibrium price of roses decreased. From this, you can conclude that between 2007 and 2008 , the supply of roses _______ and the demand for roses _______ Adjust the graph to Illustrate your answer by showing the positions of the supply and demand curves in 2008 .Note: Select and drag one or...
The following graph shows the market for laptops in 2007 . Between 2007 and 2008, the equilibrium price of laptops remained constant, but the equilibrium quantity of laptops increased.
 A supply and demand puzzleThe following graph shows the market for laptops in 2007 . Between 2007 and 2008, the equilibrium price of laptops remained constant, but the equilibrium quantity of laptops increased. From this, you can conclude that between 2007 and 2008, the supply of laptops _______ and the demand for laptops _______ Adjust the graph to illustrate your answer by showing the positions of the supply and demand curves in 2008 .Note: Select and drag one or both of...
Problem #1 14. A supply and demand puzzle The following graph shows the market for roses...
 Problem #1
14. A supply and demand puzzle The following graph shows the market for roses in 2007. Between 2007 and 2008, the equilibrium quantity of roses remained constant, but the equilibrium price of roses increased. From this, you can conclude that between 2007 and 2008, the supply of roses demand for roses and the Adjust the graph to illustrate your answer by showing the positions of the supply and demand curves in 2008. Note: Select and drag one or...
Problem #1
14. A supply and demand puzzle The following graph shows the market for roses in 2007. Between 2007 and 2008, the equilibrium quantity of roses remained constant, but the equilibrium price of roses increased. From this, you can conclude that between 2007 and 2008, the supply of roses demand for roses and the Adjust the graph to illustrate your answer by showing the positions of the supply and demand curves in 2008. Note: Select and drag one or...
 sometimes the exports of developing nations are concentrated in
only one or few primary products. for example world bank data,
tobacco consists 50% of Malawi's total exports. Therefore, changes
in demand or supply of tobacco can have significant effects on the
health of Malawi's economy
The current world price of tobacco is $5.00 per pound, but
there is uncertainty about the shape of the demand and supply
curves. Tbe following graphs (scenario A and Scenario B) show two
possiblilities for...
sometimes the exports of developing nations are concentrated in
only one or few primary products. for example world bank data,
tobacco consists 50% of Malawi's total exports. Therefore, changes
in demand or supply of tobacco can have significant effects on the
health of Malawi's economy
The current world price of tobacco is $5.00 per pound, but
there is uncertainty about the shape of the demand and supply
curves. Tbe following graphs (scenario A and Scenario B) show two
possiblilities for...
 4. Shifting curves and the importance of elasticity Consider the market for umbrellas. Suppose the quantity of umbrellas demanded by consumers (D) depends on the price of an umbrella (P) and the percentage chance of rain (R) forecasted by the local news station. Similarly, the quantity of umbrellas supplied by producers (Qs) depends on the price of an umbrella (P) and the square-foot price of waterproof nylon (N) used in the production of umbrellas. The following two graphs depict the...
 7. Using the bond-market diagram below, drag the bond demand or bond supply curves (or both) to illustrate how an increass bond risk affects equilibrium bond price and quantity. Assume that investors are risk-averse Tool tip: Click and drag one or both of back to its original position. just try again and drag it a little farther. When you are satishied with your answer, click the Submit Answer button. the curves. Curves will snap into position, so if you try...
 8. Short-run and long-run effects of a shift in demand Aa Aa Suppose that the chicken industry is in long-run equilibrium at a price of $3 per pound of chicken and a quantity of 600 million pounds per year. Suppose the Surgeon General issues a report saying that eating chicken is good for your health. The Surgeon General's report will cause consumers to demand chicken at every price. In the short run, firms will respond by Shift the supply curve,...
 The following graph shows the market for cars in 2010 . Between 2010 and 2011, the equilibrium price of cars remained constant, but the equilibrium quantity of cars decreased. From this, you can conclude that between 2010 and 2011, the supply of cars _______ and the demand for cars _______ .Adjust the graph to illustrate your answer by showing the positions of the supply and demand curves in 2011.Note: Select and drag one or both of the curves to the...
 A supply and demand puzzleThe following graph shows the market for roses in 2007 . Between 2007 and 2008 , the equilibrium quantity of roses remained constant, but the equilibrium price of roses decreased. From this, you can conclude that between 2007 and 2008 , the supply of roses _______ and the demand for roses _______ Adjust the graph to Illustrate your answer by showing the positions of the supply and demand curves in 2008 .Note: Select and drag one or...
 Problem #1
14. A supply and demand puzzle The following graph shows the market for roses in 2007. Between 2007 and 2008, the equilibrium quantity of roses remained constant, but the equilibrium price of roses increased. From this, you can conclude that between 2007 and 2008, the supply of roses demand for roses and the Adjust the graph to illustrate your answer by showing the positions of the supply and demand curves in 2008. Note: Select and drag one or...
Problem #1
14. A supply and demand puzzle The following graph shows the market for roses in 2007. Between 2007 and 2008, the equilibrium quantity of roses remained constant, but the equilibrium price of roses increased. From this, you can conclude that between 2007 and 2008, the supply of roses demand for roses and the Adjust the graph to illustrate your answer by showing the positions of the supply and demand curves in 2008. Note: Select and drag one or...
Most questions answered within 3 hours.
-
Your eye is 2.5 m away from a 60W light bulb that emits light in
all...
asked 6 minutes ago -
Cars enter a car wash at a mean rate of 2 cars per half an hour....
asked 3 minutes ago -
As a human and using your own human Intelligent Analysis (IA),
you would have noted that...
asked 8 minutes ago -
Transverse waves on a string have wave speed 8 m/s, amplitude
0.071 m, and wavelength 0.33...
asked 22 minutes ago -
Write SQL queries to answer the following question: A. Which
students are enrolled in Database and...
asked 17 minutes ago -
At −11°C a sample of carbon monoxide gas exerts a pressure of
0.45 atm. What is...
asked 22 minutes ago -
Aqueous hydrobromic acid HBr reacts with solid sodium hydroxide
NaOH to produce aqueous sodium bromide NaBr...
asked 36 minutes ago -
You dissolve 1.0 mole of a substance in water to a total volume
of 1,000 ml....
asked 41 minutes ago -
A company's total assets at the end of last year were 500,000
and its EBIT was...
asked 46 minutes ago -
Is it redundant to say that a pure substance is homogeneous, or
can it not be...
asked 49 minutes ago -
Already famous by the time he arrived at Princeton University in
1933, Einstein had suggested a...
asked 1 hour ago -
Suppose the average male brain weight (in grams) is estimated to
be 13201320 grams. A 1905...
asked 1 hour ago