


Homework Answers
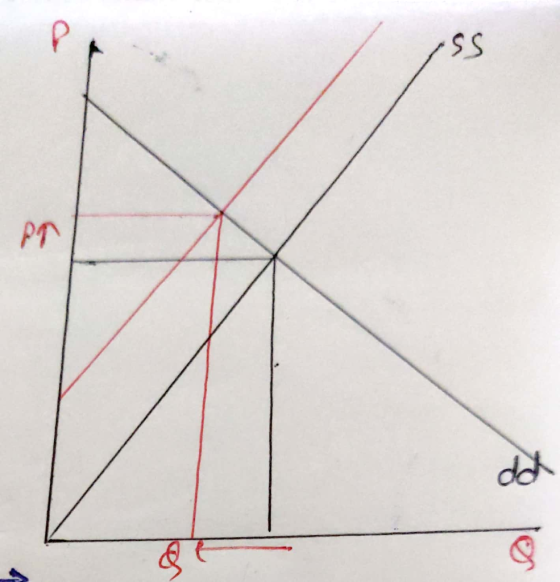
Since the supply of umbrella depends on the price of waterproof nylon and not the demand , therefore only the supply curve will shift because of increase in its price. And since waterproof nylon is an input for umbrella production, Increase in its cost will Increase the cost of production of umbrella and therefore decrease its supply. The supply curve of umbrella will therefore shift to the left.
In both markets, this change in the price of waterproof nylon causes the equilibrium quantity to decrease and the equilibrium price to increase.
You can see that although the affected. Curve ahifted by the same amount in both markets, the effect on the equilibrium quantity is smaller in the market with more steep demand.
The first image above has a steeper demand curve than the second. Steeper demand curve implies an inelastic demand. Therefore a shift of the supply curve will not affect the equilibrium quantity to that extent as it does in the market with flat / elastic demand curve. Hence the price. Increase is greater in the inelastic market and quantity decrease is smaller.
( Because the market is inelastic the quantity doesn't change much, but the cost of production has increased which has made the umbrella production costly. This means the producer has to increase the price to be able to produce the quantity demanded at an economic rate)
The shift of the supply curve is shown in red.

Add Answer to:
4. Shifting curves and the importance of elasticity Consider the market for umbrellas. Suppose the quantity...
Consider the market for snow shovels. Suppose the quantity of snow shovels demanded by consumers (QD)...
 Consider the market for snow shovels. Suppose the quantity of snow shovels demanded by consumers (QD) depends on the price of a snow shovel P) and the percentage chance of snow (S) forecasted by the local news station. Similarly, the quantity of snow shovels supplied by producers (Qs) depends on the price of a snow shovel (P) and the linear-foot price of a wooden rod (W) used in the production of snow shovels. The following two graphs depict the market...
Consider the market for pens. Suppose that the number of students with an allergy to pencil...
 Consider the market for pens. Suppose that the number of students with an allergy to pencil erasers increases, causing more students to switch from pencils to pens in school. Moreover, the price of plastic, an important input in pen production, has dropped considerably.On the following graph, labeled Scenario 1, indicate the effect these two events have on the demand for and supply of pens.Note: Select and drag one or both of the curves to the desired position. Curves will snap...
7. Using the bond-market diagram below, drag the bond demand or bond supply curves (or both)...
 7. Using the bond-market diagram below, drag the bond demand or bond supply curves (or both) to illustrate how an increass bond risk affects equilibrium bond price and quantity. Assume that investors are risk-averse Tool tip: Click and drag one or both of back to its original position. just try again and drag it a little farther. When you are satishied with your answer, click the Submit Answer button. the curves. Curves will snap into position, so if you try...
The following graph shows the market for laptops in 2007 . Between 2007 and 2008, the equilibrium price of laptops remained constant, but the equilibrium quantity of laptops increased.
 A supply and demand puzzleThe following graph shows the market for laptops in 2007 . Between 2007 and 2008, the equilibrium price of laptops remained constant, but the equilibrium quantity of laptops increased. From this, you can conclude that between 2007 and 2008, the supply of laptops _______ and the demand for laptops _______ Adjust the graph to illustrate your answer by showing the positions of the supply and demand curves in 2008 .Note: Select and drag one or both of...
*Both curves have not been adjusted, they are in the state that the question gave me.*...
 *Both curves have not been adjusted, they are in the state that
the question gave me.*
Updated Demand Curves:
2. Unstable export markets Sometimes the exports of developing nations are concentrated in only one or a few primary products. For example, according to World Bank data, tobacco constitutes 50% of Malawi's total exports Therefore, changes in demand or supply of tobacco can ha esign ficant effects on the health of Malawi's economy The current world price of tobacco is $5.00...
*Both curves have not been adjusted, they are in the state that
the question gave me.*
Updated Demand Curves:
2. Unstable export markets Sometimes the exports of developing nations are concentrated in only one or a few primary products. For example, according to World Bank data, tobacco constitutes 50% of Malawi's total exports Therefore, changes in demand or supply of tobacco can ha esign ficant effects on the health of Malawi's economy The current world price of tobacco is $5.00...
The following graph shows the market for cars in 2010
 The following graph shows the market for cars in 2010 . Between 2010 and 2011, the equilibrium price of cars remained constant, but the equilibrium quantity of cars decreased. From this, you can conclude that between 2010 and 2011, the supply of cars _______ and the demand for cars _______ .Adjust the graph to illustrate your answer by showing the positions of the supply and demand curves in 2011.Note: Select and drag one or both of the curves to the...
Consider the market for pens. Suppose that a new educational study has proven that the practice...
 Consider the market for pens. Suppose that a new educational study has proven that the practice of writing, erasing, and rewriting improves students' ability to process information, leading parents to steer away from pen use in favor of pencils. Moreover, the price of plastic, an important input in pen production, has increased considerably.On the following graph, labeled Scenario 1, indicate the effect these two events have on the demand for and supoly of pens.Note: Select and drag one or both...
The following graph shows the market for roses in 2007
 A supply and demand puzzleThe following graph shows the market for roses in 2007 . Between 2007 and 2008 , the equilibrium quantity of roses remained constant, but the equilibrium price of roses decreased. From this, you can conclude that between 2007 and 2008 , the supply of roses _______ and the demand for roses _______ Adjust the graph to Illustrate your answer by showing the positions of the supply and demand curves in 2008 .Note: Select and drag one or...
8. A supply and demand puzzle The following graph shows the market for roses in 2010....
8. A supply and demand puzzle The following graph shows the market for roses in 2010. Between 2010 and 2011, the equilibrium quantity of roses remained constant, but the equilibrium price of roses increased. From this, you can conclude that between 2010 and 2011, the supply of roses _______ and the demand for roses _______ .Adjust the graph to illustrate your answer by showing the positions of the supply and demand curves in 2011. Note: Select and drag one or both of...
The following graph shows the market for cars in 2010. Between 2010 and 2011, the equilibrium...
 The following graph shows the market for cars in 2010. Between 2010 and 2011, the equilibrium quantity of cars remained constant, but the equilibrium price of cars decreased. From this, you can conclude that between 2010 and 2011, the supply of cars increased and the demand for cars decreased . Adjust the graph to illustrate your answer by showing the positions of the supply and demand curves in 2011. Note: Select and drag one or both of the curves to...
 Consider the market for snow shovels. Suppose the quantity of snow shovels demanded by consumers (QD) depends on the price of a snow shovel P) and the percentage chance of snow (S) forecasted by the local news station. Similarly, the quantity of snow shovels supplied by producers (Qs) depends on the price of a snow shovel (P) and the linear-foot price of a wooden rod (W) used in the production of snow shovels. The following two graphs depict the market...
 7. Using the bond-market diagram below, drag the bond demand or bond supply curves (or both) to illustrate how an increass bond risk affects equilibrium bond price and quantity. Assume that investors are risk-averse Tool tip: Click and drag one or both of back to its original position. just try again and drag it a little farther. When you are satishied with your answer, click the Submit Answer button. the curves. Curves will snap into position, so if you try...
 *Both curves have not been adjusted, they are in the state that
the question gave me.*
Updated Demand Curves:
2. Unstable export markets Sometimes the exports of developing nations are concentrated in only one or a few primary products. For example, according to World Bank data, tobacco constitutes 50% of Malawi's total exports Therefore, changes in demand or supply of tobacco can ha esign ficant effects on the health of Malawi's economy The current world price of tobacco is $5.00...
*Both curves have not been adjusted, they are in the state that
the question gave me.*
Updated Demand Curves:
2. Unstable export markets Sometimes the exports of developing nations are concentrated in only one or a few primary products. For example, according to World Bank data, tobacco constitutes 50% of Malawi's total exports Therefore, changes in demand or supply of tobacco can ha esign ficant effects on the health of Malawi's economy The current world price of tobacco is $5.00...
 The following graph shows the market for cars in 2010 . Between 2010 and 2011, the equilibrium price of cars remained constant, but the equilibrium quantity of cars decreased. From this, you can conclude that between 2010 and 2011, the supply of cars _______ and the demand for cars _______ .Adjust the graph to illustrate your answer by showing the positions of the supply and demand curves in 2011.Note: Select and drag one or both of the curves to the...
 A supply and demand puzzleThe following graph shows the market for roses in 2007 . Between 2007 and 2008 , the equilibrium quantity of roses remained constant, but the equilibrium price of roses decreased. From this, you can conclude that between 2007 and 2008 , the supply of roses _______ and the demand for roses _______ Adjust the graph to Illustrate your answer by showing the positions of the supply and demand curves in 2008 .Note: Select and drag one or...
 The following graph shows the market for cars in 2010. Between 2010 and 2011, the equilibrium quantity of cars remained constant, but the equilibrium price of cars decreased. From this, you can conclude that between 2010 and 2011, the supply of cars increased and the demand for cars decreased . Adjust the graph to illustrate your answer by showing the positions of the supply and demand curves in 2011. Note: Select and drag one or both of the curves to...
Most questions answered within 3 hours.
-
SQL help:
Design a database diagram for a database that stores information
about the Downloads that...
asked 47 minutes ago -
In 1970s and 1980s, molecular biologists discovered that the
hormone testosterone, binds a receptor protein that...
asked 3 hours ago -
january 1 2010 road catering service purchase a piece of
equipment for 58000 which is expected...
asked 3 hours ago -
Explain Mertons concept of anomie is and what the
modes of adaptation to it are?
asked 4 hours ago -
Jamie is doing a survey at her school about whether the students
feel the cafeteria food...
asked 5 hours ago -
How many liters of 0.669 M KOH will be needed to raise the pH of
0.339...
asked 7 hours ago -
A liquid of density 1270 kg/m 3 flows steadily through a pipe of
varying diameter and...
asked 8 hours ago -
Questions: What should the American executive do?
'A visiting American executive finds that a foreign subsidiary...
asked 8 hours ago -
Activity based costing was introduced as an alternative to
absorption costing.
1. Discuss using illustration the...
asked 8 hours ago -
1. You own shares of Crane DVD Company and are interested in
selling them. With so...
asked 8 hours ago -
How many grams of He are necessary to fill a balloon having a
volume of 4.5E3...
asked 8 hours ago -
The 2 patients, still in the hospital, were interviewed by a
MoH epidemiologist. The interviews revealed...
asked 8 hours ago