a. Obtain and interpret the quartiles.
a. Obtain and interpret the quartiles.
Determine the quartiles.
Upper Q 1Q1 | equals= | nothing |
Upper Q 2Q2 | equals= | nothing |
Upper Q 3Q3 | equals= | nothing |
(Type integers or decimals. Do not round.)
Interpret the quartiles. Choose the correct answer below.
A.The quartiles suggest that all of the sharks bear a number of pups between
Upper Q 1Q1
and
Upper Q 3Q3.
B.The quartiles suggest that 25% of the sharks bear a number of pups less than
Upper Q 1Q1,
25% bear a number of pups between
Upper Q 1Q1
and
Upper Q 2Q2,
25% bear a number of pups between
Upper Q 2Q2
and
Upper Q 3Q3,
and 25% bear a number of pups more than
Upper Q 3Q3.
C.The quartiles suggest that the average number of borne pups is
Upper Q 2Q2.
D.The quartiles suggest that 33% of the sharks bear a number of pups less than
Upper Q 1Q1,
33% of the sharks bear a number of pups between
Upper Q 1Q1
and
Upper Q 3Q3,
and 33% of the sharks bear a number of pups more than
Upper Q 3Q3.
b. Determine and interpret the interquartile range.
The interquartile range is
nothing.
(Type an integer or a decimal. Do not round.)
Interpret the interquartile range. Choose the correct answer below.
A.
The approximate difference between each quartile is the IQR.
B.
The data span roughly the IQR.
C.
The average of the first quartile and the third quartile is the IQR.
D.
The number of borne pups in the middle 50% of sharks spans roughly the IQR.
c. Find and interpret the five-number summary.
Determine the five-number summary.
nothing,
nothing,
nothing,
nothing,
nothing
(Type integers or decimals. Do not round. Use ascending order.)
Interpret the five-number summary. Choose the correct answer below.
A.
The distance between the first quartile and the median and the distance between the median and the third quartile have more variation than the distance between the minimum and the first quartile and distance between the third quartile and the maximum.
B.
The distance between the third quartile and the maximum has the greatest variation. The distance between the minimum and the first quartile has the least variation.
C.
The distance between the median and the third quartile has the greatest variation. The distance between the first quartile and the median has the least variation.
D.
The distance between the minimum and the first quartile and distance between the third quartile and the maximum have more variation than the distance between the first quartile and the median and the distance between the median and the third quartile.
d. Identify potential outliers, if any. Choose the correct answer below and, if necessary, fill in the answer box to complete your choice.
A.The potential outlier(s) is(are)
nothing.
(Type an integer or a decimal. Do not round. Use a comma to separate answers as needed.)
B.
There are no potential outliers.
e. Obtain and interpret a boxplot.
Construct the boxplot. Choose the correct graph below.
A.
213
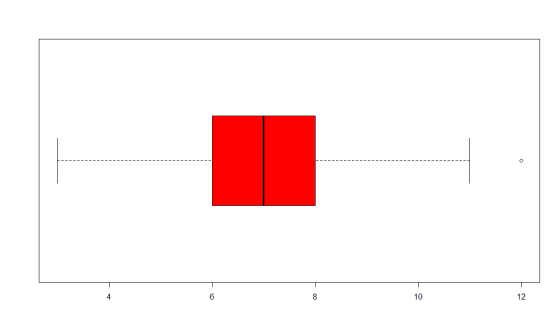
A boxplot has a horizontal axis labeled from 2 to 13 in increments of 1. There are vertical line segments drawn at the following values: 3, 6, 7, 8, 11. A box encloses the vertical line segments at 6, 7, and 8, and horizontal line segments extend outward from both sides of the box to the vertical line segments at 3 and 11. There is a mark at 12. All values are approximate.
B.
213
A boxplot has a horizontal axis labeled from 2 to 13 in increments of 1. There are vertical line segments drawn at the following values: 3, 6.5, 7, 7.5, 12. A box encloses the vertical line segments at 6.5, 7, and 7.5, and horizontal line segments extend outward from both sides of the box to the vertical line segments at 3 and 12. All values are approximate.
C.
213
A boxplot has a horizontal axis labeled from 2 to 13 in increments of 1. There are vertical line segments drawn at the following values: 3, 6.5, 7, 8, 11. A box encloses the vertical line segments at 6.5, 7, and 8, and horizontal line segments extend outward from both sides of the box to the vertical line segments at 3 and 11. There is a mark at 12. All values are approximate.
D.
213
A boxplot has a horizontal axis labeled from 2 to 13 in increments of 1. There are vertical line segments drawn at the following values: 3, 6, 7, 10, 12. A box encloses the vertical line segments at 6, 7, and 10, and horizontal line segments extend outward from both sides of the box to the vertical line segments at 3 and 12. All values are approximate.
Interpret the boxplot. Select all that apply.
A.
There is more variation in the fourth quarter than in any of the other quarters.
B.
The distribution of the data is roughly symmetric.
C.The number of borne pups varies from
33
to
1212.
D.A majority of the sharks bear between
66
and
88
pups.
E.
The potential outlying observation falls far from the rest of the data.
Homework Answers
Note: Final answers are highlighted in colour.
a)
Determine the quartiles.
R code for Quantiles
mydata=read.csv("Ans
60/Data.csv",header = TRUE)
quantile(mydata$No.of.Pups)
Output
0% 25% 50% 75% 100%
3 6 7 8 12
|
Upper Q 1Q1 |
= |
6 |
|
Upper Q 2Q2 |
= |
7 |
|
Upper Q 3Q3 |
= |
8 |
Interpret the quartiles. Choose the correct answer below.
A.The quartiles suggest that all of the sharks bear a number of pups between Upper Q 1Q1 and Upper Q 3Q3.
B.The quartiles suggest that 25% of the sharks bear a number of pups less than Upper Q 1Q1, 25% bear a number of pups between Upper Q 1Q1 and Upper Q 2Q2, 25% bear a number of pups between Upper Q 2Q2 and Upper Q3Q3, and 25% bear a number of pups more than Upper Q 3Q3.
C.The quartiles suggest that the average number of borne pups is Upper Q 2Q2.
D.The quartiles suggest that 33% of the sharks bear a number of pups less than Upper Q 1Q1, 33% of the sharks bear a number of pups between Upper Q 1Q1 and Upper Q 3Q3, and 33% of the sharks bear a number of pups more than Upper Q 3Q3.
c)
IQR= Q3-Q1= 8-6=2
The interquartile range is 2
Interpret the interquartile range. Choose the correct answer below.
A.The approximate difference between each quartile is the IQR.
B.The data span roughly the IQR.
C.The average of the first quartile and the third quartile is the IQR.
D.The number of borne pups in the middle 50% of sharks spans roughly the IQR.
d.
Outlier exists if any value is outside the range ( Q1−1.5×IQR, Q3+1.5×IQR )
(6-1.5*2 , 8+1.5*2)= (3,11).
There is one value(12) outside the mentioned range.
Identify potential outliers, if any. Choose the correct answer below and, if necessary, fill in the answer box to complete your choice.
A.The potential outlier is 12
B.There are no potential outliers.
e. Obtain and interpret a boxplot.
Construct the boxplot. Choose the correct graph below.
A.
A boxplot has a horizontal axis labeled from 2 to 13 in increments of 1. There are vertical line segments drawn at the following values: 3, 6, 7, 8, 11. A box encloses the vertical line segments at 6, 7, and 8, and horizontal line segments extend outward from both sides of the box to the vertical line segments at 3 and 11. There is a mark at 12. All values are approximate.
B.
A boxplot has a horizontal axis labeled from 2 to 13 in increments of 1. There are vertical line segments drawn at the following values: 3, 6.5, 7, 7.5, 12. A box encloses the vertical line segments at 6.5, 7, and 7.5, and horizontal line segments extend outward from both sides of the box to the vertical line segments at 3 and 12. All values are approximate.
C.
A boxplot has a horizontal axis labeled from 2 to 13 in increments of 1. There are vertical line segments drawn at the following values: 3, 6.5, 7, 8, 11. A box encloses the vertical line segments at 6.5, 7, and 8, and horizontal line segments extend outward from both sides of the box to the vertical line segments at 3 and 11. There is a mark at 12. All values are approximate.
D.
213
A boxplot has a horizontal axis labeled from 2 to 13 in increments of 1. There are vertical line segments drawn at the following values: 3, 6, 7, 10, 12. A box encloses the vertical line segments at 6, 7, and 10, and horizontal line segments extend outward from both sides of the box to the vertical line segments at 3 and 12. All values are approximate.
Interpret the boxplot. Select all that apply.
A.There is more variation in the fourth quarter than in any of the other quarters.
B.The distribution of the data is roughly symmetric.
C.The number of borne pups varies from 3 to 12.
D.A majority of the sharks bear between 6 and 8 pups.
E.The potential outlying observation falls far from the rest of the data.
The data show the number of hours of television watched per day by a sample of...
The data show the number of hours of television watched per day by a sample of 28 people. Use technology to answer parts (a) and (b) below. 55 99 77 00 11 00 66 77 44 00 99 33 55 44 22 55 77 00 00 77 88 33 88 00 22 88 88 00 a. Find the data set's first, second, and third quartiles. Upper Q 1Q1 equals= nothing Upper Q 2Q2 equals= nothing Upper Q 3Q3 equals= nothing...
A light bulb manufacturer guarantees that the mean life of a certain type of light bulb...
A light bulb manufacturer guarantees that the mean life of a certain type of light bulb is at least 753 hours. A random sample of 20 light bulbs has a mean life of 732 hours. Assume the population is normally distributed and the population standard deviation is 61 hours. At α=0.02, do you have enough evidence to reject the manufacturer's claim? Complete parts (a) through (e). (a) Identify the null hypothesis and alternative hypothesis. A. H0: μ<732 (claim) Ha: μ≥732...
first one is example. i need to solve second picture. 3,4 picture apply to step 1...
 first one is example.
i need to solve second picture. 3,4 picture apply to step 1 and 2.
that is CAD problems thanks
Objective: The following figures represent model views in an engineering drawing. First, inspect each cross-section and write down observations about the geometry le... shape is square, all rounds are equal in size, etc.). Second, determine the DOF of curves. Third, determine the DOF removed by constraints (e.8., 1 pair of parallel lines removes 1 DOF, etc.). Finally,...
first one is example.
i need to solve second picture. 3,4 picture apply to step 1 and 2.
that is CAD problems thanks
Objective: The following figures represent model views in an engineering drawing. First, inspect each cross-section and write down observations about the geometry le... shape is square, all rounds are equal in size, etc.). Second, determine the DOF of curves. Third, determine the DOF removed by constraints (e.8., 1 pair of parallel lines removes 1 DOF, etc.). Finally,...
i need help on question 3 to 22 please. Midterm ex review. MATH 101 Use the...
 i need help on question 3 to 22 please.
Midterm ex review. MATH 101 Use the following information to answer the next four exercises. The midterm grades on a chemistry exam, graded on a scale of 0 to 100, were: 62, 64, 65, 65, 68, 70, 72, 72, 74, 75, 75, 75, 76,78, 78, 81, 82, 83, 84, 85, 87, 88, 92, 95, 98, 98, 100, 100,740 1. Do you see any outliers in this data? If so, how would...
i need help on question 3 to 22 please.
Midterm ex review. MATH 101 Use the following information to answer the next four exercises. The midterm grades on a chemistry exam, graded on a scale of 0 to 100, were: 62, 64, 65, 65, 68, 70, 72, 72, 74, 75, 75, 75, 76,78, 78, 81, 82, 83, 84, 85, 87, 88, 92, 95, 98, 98, 100, 100,740 1. Do you see any outliers in this data? If so, how would...
Consider a cylindrical capacitor like that shown in Fig. 24.6. Let d = rb − ra...
 Consider a cylindrical capacitor like that shown in Fig. 24.6. Let d = rb − ra be the spacing between the inner and outer conductors. (a) Let the radii of the two conductors be only slightly different, so that d << ra. Show that the result derived in Example 24.4 (Section 24.1) for the capacitance of a cylindrical capacitor then reduces to Eq. (24.2), the equation for the capacitance of a parallel-plate capacitor, with A being the surface area of...
The following guidelines outline the basic template for a robot vacuum cleaner game. The game must be implemented in c programming language. It mimics a robotic vacuum cleaner. The code must only use...
The following guidelines outline the basic template for a robot vacuum cleaner game. The game must be implemented in c programming language. It mimics a robotic vacuum cleaner. The code must only use the following libraries: #include <math.h> #include <stdlib.h> #include <string.h> #include <limits.h> and any .graphics and .timers libraries. The guidelines are outlined as follows: Terminal Set-up: you may assume that the terminal will be quite large, for example, on the order of 150×50, or more. Status Display: The...
The following guidelines outline the basic template for a robot vacuum cleaner game. The game must...
The following guidelines outline the basic template for a robot vacuum cleaner game. The game must be implemented in c programming language. It mimics a robotic vacuum cleaner. The code must only use the following libraries: #include <math.h> #include <stdlib.h> #include <string.h> #include <limits.h> and any .graphics and .timers libraries. The guidelines are outlined as follows: Terminal Set-up: you may assume that the terminal will be quite large, for example, on the order of 150×50, or more. Status Display: The...
Using the book, write another paragraph or two: write 170 words: Q: Compare the assumptions of...
 Using the book, write another paragraph or two: write 170
words:
Q: Compare the assumptions of physician-centered and
collaborative communication. How is the caregiver’s role different
in each model? How is the patient’s role different?
Answer: Physical-centered communication involves the specialists
taking control of the conversation. They decide on the topics of
discussion and when to end the process. The patient responds to the
issues raised by the caregiver and acts accordingly. On the other
hand, Collaborative communication involves a...
Using the book, write another paragraph or two: write 170
words:
Q: Compare the assumptions of physician-centered and
collaborative communication. How is the caregiver’s role different
in each model? How is the patient’s role different?
Answer: Physical-centered communication involves the specialists
taking control of the conversation. They decide on the topics of
discussion and when to end the process. The patient responds to the
issues raised by the caregiver and acts accordingly. On the other
hand, Collaborative communication involves a...
I need Summary of this Paper i dont need long summary i need What methodology they used , what is the purpose of this p...
 I need Summary of this Paper i dont need long summary i need
What methodology they used , what is the purpose of this paper and
some conclusions and contributes of this paper. I need this for my
Finishing Project so i need this ASAP please ( IN 1-2-3 HOURS
PLEASE !!!)
Budgetary Policy and Economic Growth Errol D'Souza The share of capital expenditures in government expenditures has been slipping and the tax reforms have not yet improved the income...
I need Summary of this Paper i dont need long summary i need
What methodology they used , what is the purpose of this paper and
some conclusions and contributes of this paper. I need this for my
Finishing Project so i need this ASAP please ( IN 1-2-3 HOURS
PLEASE !!!)
Budgetary Policy and Economic Growth Errol D'Souza The share of capital expenditures in government expenditures has been slipping and the tax reforms have not yet improved the income...
 first one is example.
i need to solve second picture. 3,4 picture apply to step 1 and 2.
that is CAD problems thanks
Objective: The following figures represent model views in an engineering drawing. First, inspect each cross-section and write down observations about the geometry le... shape is square, all rounds are equal in size, etc.). Second, determine the DOF of curves. Third, determine the DOF removed by constraints (e.8., 1 pair of parallel lines removes 1 DOF, etc.). Finally,...
first one is example.
i need to solve second picture. 3,4 picture apply to step 1 and 2.
that is CAD problems thanks
Objective: The following figures represent model views in an engineering drawing. First, inspect each cross-section and write down observations about the geometry le... shape is square, all rounds are equal in size, etc.). Second, determine the DOF of curves. Third, determine the DOF removed by constraints (e.8., 1 pair of parallel lines removes 1 DOF, etc.). Finally,...
 i need help on question 3 to 22 please.
Midterm ex review. MATH 101 Use the following information to answer the next four exercises. The midterm grades on a chemistry exam, graded on a scale of 0 to 100, were: 62, 64, 65, 65, 68, 70, 72, 72, 74, 75, 75, 75, 76,78, 78, 81, 82, 83, 84, 85, 87, 88, 92, 95, 98, 98, 100, 100,740 1. Do you see any outliers in this data? If so, how would...
i need help on question 3 to 22 please.
Midterm ex review. MATH 101 Use the following information to answer the next four exercises. The midterm grades on a chemistry exam, graded on a scale of 0 to 100, were: 62, 64, 65, 65, 68, 70, 72, 72, 74, 75, 75, 75, 76,78, 78, 81, 82, 83, 84, 85, 87, 88, 92, 95, 98, 98, 100, 100,740 1. Do you see any outliers in this data? If so, how would...
 Consider a cylindrical capacitor like that shown in Fig. 24.6. Let d = rb − ra be the spacing between the inner and outer conductors. (a) Let the radii of the two conductors be only slightly different, so that d << ra. Show that the result derived in Example 24.4 (Section 24.1) for the capacitance of a cylindrical capacitor then reduces to Eq. (24.2), the equation for the capacitance of a parallel-plate capacitor, with A being the surface area of...
 Using the book, write another paragraph or two: write 170
words:
Q: Compare the assumptions of physician-centered and
collaborative communication. How is the caregiver’s role different
in each model? How is the patient’s role different?
Answer: Physical-centered communication involves the specialists
taking control of the conversation. They decide on the topics of
discussion and when to end the process. The patient responds to the
issues raised by the caregiver and acts accordingly. On the other
hand, Collaborative communication involves a...
Using the book, write another paragraph or two: write 170
words:
Q: Compare the assumptions of physician-centered and
collaborative communication. How is the caregiver’s role different
in each model? How is the patient’s role different?
Answer: Physical-centered communication involves the specialists
taking control of the conversation. They decide on the topics of
discussion and when to end the process. The patient responds to the
issues raised by the caregiver and acts accordingly. On the other
hand, Collaborative communication involves a...
 I need Summary of this Paper i dont need long summary i need
What methodology they used , what is the purpose of this paper and
some conclusions and contributes of this paper. I need this for my
Finishing Project so i need this ASAP please ( IN 1-2-3 HOURS
PLEASE !!!)
Budgetary Policy and Economic Growth Errol D'Souza The share of capital expenditures in government expenditures has been slipping and the tax reforms have not yet improved the income...
I need Summary of this Paper i dont need long summary i need
What methodology they used , what is the purpose of this paper and
some conclusions and contributes of this paper. I need this for my
Finishing Project so i need this ASAP please ( IN 1-2-3 HOURS
PLEASE !!!)
Budgetary Policy and Economic Growth Errol D'Souza The share of capital expenditures in government expenditures has been slipping and the tax reforms have not yet improved the income...
Most questions answered within 3 hours.
-
Write a program to solve the Josephus problem, with the following
modification:
Sample Input:
./a.out n...
asked 1 hour ago -
At the start of a CD it is spinning at a rate of 525 rpm
(revolutions...
asked 2 hours ago -
4. Without doing any calculations, predict whether the observed
∆T would increase, decrease or remain the...
asked 3 hours ago -
Based on the range, which of the following sets of scores has
the greatest variability? 3,...
asked 4 hours ago -
Ripples in a pond travel at a velocity of 3 m/s with one peak
passing a...
asked 4 hours ago -
A man stands on the roof of a building of height 13.0 mm and
throws a...
asked 4 hours ago -
The extent to which assets are financed by borrowed funds and
other liabilities is indicated by:...
asked 5 hours ago -
Explain in detail
Germany is the fifth largest economy
explain what goods and services Germany specializes...
asked 5 hours ago -
The density of platinum is 21.45 g/mL. If a cube of platinum
with a mass of...
asked 5 hours ago -
Accounts Receivable
Sales
A/R Posting
Extended Sales Invoice
Packing Slip
Compare invoice to packing slip 2...
asked 5 hours ago -
Michaella, age 23, is a full-time law student and is claimed by
her parents as a...
asked 5 hours ago -
Why are polymers not typically casted into products?
asked 6 hours ago