That is the question. There's no more information I can give you about it.
Homework Answers


Add Answer to:
That is the question. There's no more information I
can give you about it.
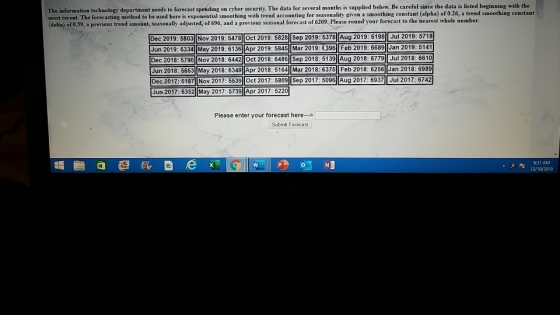
The information...
The human resources department needs to forecast the number of employees at a site. The data...
 The human resources department needs to forecast the number of employees at a site. The data for several months is supplied below. Be careful since the data is listed beginning with the most recent. The forecasting method to be used here is the 7 month moving average. Please round your forecast to the nearest whole number Nov 2019: 956 Oct 2019: 1014 Sep 2019: 1009 Aug 2019: 963 Jul 2019: 966 Jun 2019: 1024 May 2019: 1045||Apr 2019: 1047 Mar...
Given the following history, use a three-quarter moving average to forecast the demand for the third...
Given the following history, use a three-quarter moving average to forecast the demand for the third quarter of this year. Note, the 1st quarter is Jan, Feb, and Mar; 2nd quarter Apr, May, Jun; 3rd quarter Jul, Aug, Sep; and 4th quarter Oct, Nov, Dec. JAN FEB MAR APR MAY JUN JUL AUG SEP OCT NOV DEC Last year 170 200 210 240 250 270 225 215 215 275 280 300 This year 205 210 140 255 245 220 Forecast...
If there are any seasonality or relationship between the price and the US oil price? How...
If there are any seasonality or relationship between the price and the US oil price? How to analyze? Jan-10 2.769 Jan-11 3.148 Jan-12 3.44 Jan-13 3.391 Jan-14 3.392 Feb-10 2.699 Feb-11 3.264 Feb-12 3.64 Feb-13 3.736 Feb-14 3.434 Mar-10 2.824 Mar-11 3.615 Mar-12 3.907 Mar-13 3.779 Mar-14 3.606 Apr-10 2.9 Apr-11 3.852 Apr-12 3.958 Apr-13 3.638 Apr-14 3.735 May-10 2.89 May-11 3.96 May-12 3.791 May-13 3.675 May-14 3.75 Jun-10 2.785 Jun-11 3.735 Jun-12 3.596 Jun-13 3.689 Jun-14 3.766 Jul-10 2.782...
Moving average (MA) Calculate the sales using 2, 3, 4, 5, and 6 month moving average...
Moving average (MA) Calculate the sales using 2, 3, 4, 5, and 6 month moving average values. Forecast and plot the upcoming period’s sales using the moving average series that fits best. Explain why you chose that particular MA. Why is it inadvisable to use the Moving Average approach to forecast far into the future? Month Sale Month Sale Month Sale Oct-12 13.30 Oct-13 24.01 Oct-14 50.56 Nov-12 1.70 Nov-13 32.67 Nov-14 60.06 Dec-12 11.44 Dec-13 23.19 Dec-14 61.73 Jan-13...
AmeriPlas, Inc., produces 20-ounce plastic drinking cups that are embossed with the names of prominent beers...
AmeriPlas, Inc., produces 20-ounce plastic drinking cups that are embossed with the names of prominent beers and soft drinks. The sales data are: Date Sales Jan-13 40,358 Feb-13 45,002 Mar-13 63,165 Apr-13 57,479 May-13 52,308 Jun-13 60,062 Jul-13 51,694 Aug-13 54,469 Sep-13 48,284 Oct-13 45,239 Nov-13 40,665 Dec-13 47,968 Jan-14 37,255 Feb-14 38,521 Mar-14 55,110 Apr-14 51,389 May-14 58,068 Jun-14 64,028 Jul-14 52,873 Aug-14 62,584 Sep-14 53,373 Oct-14 52,060 Nov-14 51,727 Dec-14 51,455 Jan-15 47,906 Feb-15 53,570 Mar-15 69,189 Apr-15...
Consider five years of monthly sales data for a company in the attached file (Q5.xlsx). a) Foreca...
 Consider five years of monthly sales data for a company in the
attached file (Q5.xlsx). a) Forecast monthly sales for the next
year (2020). (10 marks) b) Discuss whether a simple exponential
smoothing model works well with this data or not. (5 m
7 9 Month Sales 747 Feb-14 697 Mar-14 1014 Jan-14 Ap4 1126 May-14 1105 Jun-14 1450 Jul-14 1633 Aug-14 1711 Sep-14 1307 Oct-1223 Nov-14 9T5 Dec-14S53 4J-15 1024 Feb-15928 Mar-151442 7Apr-151371 May-15 1536 Ju15 2004 Jul-15 1854...
Consider five years of monthly sales data for a company in the
attached file (Q5.xlsx). a) Forecast monthly sales for the next
year (2020). (10 marks) b) Discuss whether a simple exponential
smoothing model works well with this data or not. (5 m
7 9 Month Sales 747 Feb-14 697 Mar-14 1014 Jan-14 Ap4 1126 May-14 1105 Jun-14 1450 Jul-14 1633 Aug-14 1711 Sep-14 1307 Oct-1223 Nov-14 9T5 Dec-14S53 4J-15 1024 Feb-15928 Mar-151442 7Apr-151371 May-15 1536 Ju15 2004 Jul-15 1854...
what formulas would I use to work out these calculations? Please help!! You complete using any...
 what formulas would I use to work out these calculations?
Please help!!
You complete using any method you've learnt This is done for you You complete Financial Year Summary Sheet Patron Revenue Total Product Profit Total Staff Cost Gross Profit Monthly Profit Jul-18) Aug-18 Sep-18 Oct-18 Nov-18 Dec-18 Jan-19 Feb-19 Mar-19 Apr-19 May-19 Jun-19 Monthly Fixed Costs $ 23,800 $ 23,800 $ 23,800 $ 23,800 $ 23,800 $ 23,800 $ 29,500 $ 29,500 $ 29,500 $ 29,500 $ 29,500 $...
what formulas would I use to work out these calculations?
Please help!!
You complete using any method you've learnt This is done for you You complete Financial Year Summary Sheet Patron Revenue Total Product Profit Total Staff Cost Gross Profit Monthly Profit Jul-18) Aug-18 Sep-18 Oct-18 Nov-18 Dec-18 Jan-19 Feb-19 Mar-19 Apr-19 May-19 Jun-19 Monthly Fixed Costs $ 23,800 $ 23,800 $ 23,800 $ 23,800 $ 23,800 $ 23,800 $ 29,500 $ 29,500 $ 29,500 $ 29,500 $ 29,500 $...
calculate the monthly time-weighted and money weighted returns for shareholders in the ADKSX with using excel....
calculate the monthly time-weighted and money weighted returns for shareholders in the ADKSX with using excel. In a text box nearby, comment on whether investors’ trading decisions have created value. Month ADKSX Return (%) ADKSX Cash Flow ($) Nov-09 3.49 -$10,648,393 Dec-09 6.93 -$618,800 Jan-10 -2.05 $940,820 Feb-10 5.74 -$2,484,437 Mar-10 5.19 -$3,699,836 Apr-10 5.48 -$1,379,757 May-10 -4.68 $2,145,936 Jun-10 -6.31 -$2,953,884 Jul-10 5.9 -$4,160,472 Aug-10 -5.18 $1,096,304 Sep-10 8.61 -$5,571,657 Oct-10 4.5 -$669,464 Nov-10 2.77 -$3,145,367 Dec-10 9.16 -$6,162,018...
Calculate the sample correlation coefficient rxy. Calculate the value of the test statistic. Date Energy Healthcare...
Calculate the sample correlation coefficient rxy. Calculate the value of the test statistic. Date Energy Healthcare Jan-10 -4.87 -0.15 Feb-10 1.8 0.53 Mar-10 2.26 1.41 Apr-10 3.03 -3.75 May-10 -11.5 -5.12 Jun-10 -5.67 -0.52 Jul-10 8.73 1.49 Aug-10 -5.99 -0.97 Sep-10 10.15 8.24 Oct-10 3.89 2.28 Nov-10 2.85 -2.52 Dec-10 5.55 1.4 Jan-11 6.6 1.55 Feb-11 5.7 3.04 Mar-11 1.32 1.22 Apr-11 1.64 5.89 May-11 -4.06 2.62 Jun-11 -2.08 -0.55 Jul-11 1.14 -2.64 Aug-11 -10.41 -2.8 Sep-11 -15.06 -4.17 Oct-11...
Give 3 forecasts for January 2007. Be sure to label the units. Naïve forecast: _______________ MA(2):...
 Give 3 forecasts for January 2007. Be sure to label the
units.
Naïve forecast: _______________
MA(2): _______________
MA(4): _______________
Gasoline Price Example: Data are given on the 2006 monthly prices of Gasoline($/gallon). Month Jan Feb Mar Apr May Jun Jul Aug Sep Oct Nov Dec Gasoline 2.359 2.354 2.444 2.801 2.993 2.963 3.046 3.033 2.637 2.319 2.287 2.380 MA
Give 3 forecasts for January 2007. Be sure to label the
units.
Naïve forecast: _______________
MA(2): _______________
MA(4): _______________
Gasoline Price Example: Data are given on the 2006 monthly prices of Gasoline($/gallon). Month Jan Feb Mar Apr May Jun Jul Aug Sep Oct Nov Dec Gasoline 2.359 2.354 2.444 2.801 2.993 2.963 3.046 3.033 2.637 2.319 2.287 2.380 MA
 The human resources department needs to forecast the number of employees at a site. The data for several months is supplied below. Be careful since the data is listed beginning with the most recent. The forecasting method to be used here is the 7 month moving average. Please round your forecast to the nearest whole number Nov 2019: 956 Oct 2019: 1014 Sep 2019: 1009 Aug 2019: 963 Jul 2019: 966 Jun 2019: 1024 May 2019: 1045||Apr 2019: 1047 Mar...
 Consider five years of monthly sales data for a company in the
attached file (Q5.xlsx). a) Forecast monthly sales for the next
year (2020). (10 marks) b) Discuss whether a simple exponential
smoothing model works well with this data or not. (5 m
7 9 Month Sales 747 Feb-14 697 Mar-14 1014 Jan-14 Ap4 1126 May-14 1105 Jun-14 1450 Jul-14 1633 Aug-14 1711 Sep-14 1307 Oct-1223 Nov-14 9T5 Dec-14S53 4J-15 1024 Feb-15928 Mar-151442 7Apr-151371 May-15 1536 Ju15 2004 Jul-15 1854...
Consider five years of monthly sales data for a company in the
attached file (Q5.xlsx). a) Forecast monthly sales for the next
year (2020). (10 marks) b) Discuss whether a simple exponential
smoothing model works well with this data or not. (5 m
7 9 Month Sales 747 Feb-14 697 Mar-14 1014 Jan-14 Ap4 1126 May-14 1105 Jun-14 1450 Jul-14 1633 Aug-14 1711 Sep-14 1307 Oct-1223 Nov-14 9T5 Dec-14S53 4J-15 1024 Feb-15928 Mar-151442 7Apr-151371 May-15 1536 Ju15 2004 Jul-15 1854...
 what formulas would I use to work out these calculations?
Please help!!
You complete using any method you've learnt This is done for you You complete Financial Year Summary Sheet Patron Revenue Total Product Profit Total Staff Cost Gross Profit Monthly Profit Jul-18) Aug-18 Sep-18 Oct-18 Nov-18 Dec-18 Jan-19 Feb-19 Mar-19 Apr-19 May-19 Jun-19 Monthly Fixed Costs $ 23,800 $ 23,800 $ 23,800 $ 23,800 $ 23,800 $ 23,800 $ 29,500 $ 29,500 $ 29,500 $ 29,500 $ 29,500 $...
what formulas would I use to work out these calculations?
Please help!!
You complete using any method you've learnt This is done for you You complete Financial Year Summary Sheet Patron Revenue Total Product Profit Total Staff Cost Gross Profit Monthly Profit Jul-18) Aug-18 Sep-18 Oct-18 Nov-18 Dec-18 Jan-19 Feb-19 Mar-19 Apr-19 May-19 Jun-19 Monthly Fixed Costs $ 23,800 $ 23,800 $ 23,800 $ 23,800 $ 23,800 $ 23,800 $ 29,500 $ 29,500 $ 29,500 $ 29,500 $ 29,500 $...
 Give 3 forecasts for January 2007. Be sure to label the
units.
Naïve forecast: _______________
MA(2): _______________
MA(4): _______________
Gasoline Price Example: Data are given on the 2006 monthly prices of Gasoline($/gallon). Month Jan Feb Mar Apr May Jun Jul Aug Sep Oct Nov Dec Gasoline 2.359 2.354 2.444 2.801 2.993 2.963 3.046 3.033 2.637 2.319 2.287 2.380 MA
Give 3 forecasts for January 2007. Be sure to label the
units.
Naïve forecast: _______________
MA(2): _______________
MA(4): _______________
Gasoline Price Example: Data are given on the 2006 monthly prices of Gasoline($/gallon). Month Jan Feb Mar Apr May Jun Jul Aug Sep Oct Nov Dec Gasoline 2.359 2.354 2.444 2.801 2.993 2.963 3.046 3.033 2.637 2.319 2.287 2.380 MA
Most questions answered within 3 hours.
-
the following reaction occurs in a balloon containing
N2O2 gas
N2O4(g)=2NO2(g)
will the volume of the...
asked 22 minutes ago -
answer the questions throughout this program
public class Day implements Comparable {
Private Boolean atWork;...
asked 30 minutes ago -
This is C++ code for parking fee management program
#include <iostream>
#include <iomanip>
using namespace std;...
asked 41 minutes ago -
The free energy change for the following reaction at 25 °C, when
[Sn2+] = 1.17 M...
asked 2 hours ago -
An MNE is this kind of industry when competition in one country
is essentially independent of...
asked 3 hours ago -
. For this set of questions, determine what
proportion of a normal distribution is located betweeneach...
asked 4 hours ago -
A college student is employed as a door-to-door newspaper
salesman. Historical data suggests that the student...
asked 5 hours ago -
MATLAB HW 11 problem using Switch Case and Input commands
Write a script file that calculates...
asked 5 hours ago -
Considering gravitational time dilation, calculate the time that
passes in Earth’s surface while 1 hour passes...
asked 5 hours ago -
Minitab Problem: Take the Lake Hume June rainfall data and find
use the processes outlined in...
asked 6 hours ago -
X Company is trying to decide whether to continue using old
equipment to make Product A...
asked 6 hours ago -
IN PYTHON ONLY !! Program 2: Re-work
program #5 (WeeklyHours) from the previous assignment such that...
asked 7 hours ago