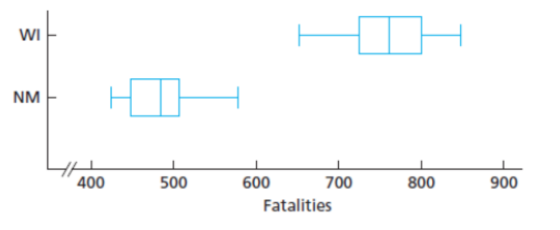
From the Fatality Analysis Reporting System (FARS) of the National Highway Traffic Safety Administration, we obtained data on the numbers of traffic fatalities in Wisconsin and New Mexico for the years 1982–2003. Use the following boxplot for those data to compare the traffic fatalities in the two states, paying special attention to center and variation.
Homework Answers
From provided bixpot of traffic fatalities in Wisconsin and New Mexico for the years 1982–2003
Following points are observed ,
1. There is more traffic fatalities in Wisconsin than New Mexico for the years 1982–2003.
2. Center (Median) of traffic fatalities in Wisconsin and New Mexico are approximately 750 and 490 respectively.
3. Variations for traffic fatalities in Wisconsin and New Mexico for the years 1982–2003 look like same.
Thank You!
Add Answer to:
From the Fatality Analysis Reporting System (FARS) of the
National Highway Traffic Safety Administration, we obtained...
The U.S. National Highway Traffic Safety Administration gathers data concerning the causes of highway crashes where...
The U.S. National Highway Traffic Safety Administration gathers data concerning the causes of highway crashes where at least one fatality has occurred. From the 1998 annual study, the following probabilities were determined (BAC is blood-alcohol level): ?(???=0|Crash with fatality)=0.625 ?(??? is between .01 and .09|Crash with fatality)=0.302 ?(??? is greater than .09|Crash with fatality)=0.069 Suppose over a certain stretch of highway during a 1-year period, the probability of being involved in a crash that results in at least one fatality...
The U.S. National Highway Traffic Safety Administration gathers data concerning the causes of highway crashes where...
The U.S. National Highway Traffic Safety Administration gathers data concerning the causes of highway crashes where at least one fatality has occurred. From the 1998 annual study, the following probabilities were determined (BAC is blood-alcohol level): P(BAC=0|Crash with fatality)=0.611 P(BAC is between .01 and .09|Crash with fatality)=0.347 P(BAC is greater than .09|Crash with fatality)=0.054 Suppose over a certain stretch of highway during a 1-year period, the probability of being involved in a crash that results in at least one fatality...
The U.S. Department of Transportation, National Highway Traffic Safety Administration, reported that 77% of all fatally...
The U.S. Department of Transportation, National Highway Traffic Safety Administration, reported that 77% of all fatally injured automobile drivers were intoxicated. A random sample of 31 records of automobile driver fatalities in Kit Carson County, Colorado, showed that 18 involved an intoxicated driver. Do these data indicate that the population proportion of driver fatalities related to alcohol is less than 77% in Kit Carson County? Use α = 0.01. Solve the problem using both the traditional method and the P-value...
please complete A and B Chi-square Problems 1. The National Highway Traffic Safety Administration publishes reports...
 please complete A and B
Chi-square Problems 1. The National Highway Traffic Safety Administration publishes reports about motorcycle fatalities and helmet use. The distribution below shows the proportion of fatalities by location of injury for motorcycle accidents. Location of Injury Multiple location Head Proportion 0.57 0.31 Neck 0.03 Thorax 0.06 Abdomen/Lumbar/Spine 0.03 Data below show the location of injury and fatalities for 2068 riders not wearing a helmet. Location of Injury Multiple location Head Number 1036 864 38 83 Neck...
please complete A and B
Chi-square Problems 1. The National Highway Traffic Safety Administration publishes reports about motorcycle fatalities and helmet use. The distribution below shows the proportion of fatalities by location of injury for motorcycle accidents. Location of Injury Multiple location Head Proportion 0.57 0.31 Neck 0.03 Thorax 0.06 Abdomen/Lumbar/Spine 0.03 Data below show the location of injury and fatalities for 2068 riders not wearing a helmet. Location of Injury Multiple location Head Number 1036 864 38 83 Neck...
Previous Problem Problem List Next Problem (1 point) The U.S. National Highway Traffic Safety Administration gathers...
 Previous Problem Problem List Next Problem (1 point) The U.S. National Highway Traffic Safety Administration gathers data concerning the causes of highway crashes where at least one fatality has occurred. From the 1998 annual study, the following probabilities were determined (BAC is blood-alcohol level): P(BAC =0|Crash with fatality) = 0.613 P(BAC is between .01 and .09|Crash with fatality) = 0.335 P(BAC is greater than .09|Crash with fatality) = 0.054 Suppose over a certain stretch of highway during a 1-year period,...
The National Highway Traffic Safety Administration reported the percentage of traffic accidents occurring each day of...
 The National Highway Traffic Safety Administration reported the percentage of traffic accidents occurring each day of the week. Assume that a sample of 420 acdldents provided the following data. Sunday Monday Tuesday Wednesday Thursday Friday Saturday 50 64 48 56 53 70 9 a. Conduct a hypothesis test to determine if the proportion of traffic accidents is the same for each day of the week. What is the p-value? Compute the value of the ?2 test statistic (to 3 decimals)....
The National Highway Traffic Safety Administration (NHTSA) claims that, in a car accident, Tesla passengers are...
The National Highway Traffic Safety Administration (NHTSA) claims that, in a car accident, Tesla passengers are less likely to be injured than their non-Tesla counterparts. They select a random sample of 200 Tesla passengers and 400 non-Tesla passengers who were in a car accident. From their data, they found that 5.5% of the Tesla passengers and 9% of the non-Tesla passengers were injured. Test the NHTSA’s claim at a 10% significance level. a) Define Population 1 and Population 2. b)...
The National Highway Traffic Safety Administration reported the percentage of traffic accidents occurring each day of...
 The National Highway Traffic Safety Administration reported the percentage of traffic accidents occurring each day of the week. Assume that a sample of 420 accidents provided the following data Sunday Monday Tues day Wednesday Thursday riday Saturday 50 53 47 69 (a) Conduct a hypothesis test to determine if the proportion of traffic accidents is the same for each day of the week. Use a 0.05 level of significance. State the null and alternative hypotheses. Ho: Not all proportions are...
The U.S. Department of Transportation, National Highway Traffic Safety Administration, reported that 77% of all fatally...
 The U.S. Department of Transportation, National Highway
Traffic Safety Administration, reported that 77% of all fatally
injured automobile drivers were intoxicated. A random sample of 28
records of automobile driver fatalities in Kit Carson County,
Colorado, showed that 14 involved an intoxicated driver. Do these
data indicate that the population proportion of driver fatalities
related to alcohol is less than 77% in Kit Carson County? Use α =
0.01. Solve the problem using both the traditional method and the
P-value...
The U.S. Department of Transportation, National Highway
Traffic Safety Administration, reported that 77% of all fatally
injured automobile drivers were intoxicated. A random sample of 28
records of automobile driver fatalities in Kit Carson County,
Colorado, showed that 14 involved an intoxicated driver. Do these
data indicate that the population proportion of driver fatalities
related to alcohol is less than 77% in Kit Carson County? Use α =
0.01. Solve the problem using both the traditional method and the
P-value...
thanks for your help The National Highway Traffic Safety Administration reported the percentage of traffic accidents...
 thanks for your help
The National Highway Traffic Safety Administration reported the percentage of traffic accidents occurring each day of the week. Assume that a sample of 420 accidents provided the following data Sunday Monday Tuesday Wednesday Thursday Friday Saturday 65 52 54 45 52 72 80 a. Conduct a hypothesis test to determine if the proportion of traffic accidents is the same for each day of the week. What is the p value? Compute the value of the test...
thanks for your help
The National Highway Traffic Safety Administration reported the percentage of traffic accidents occurring each day of the week. Assume that a sample of 420 accidents provided the following data Sunday Monday Tuesday Wednesday Thursday Friday Saturday 65 52 54 45 52 72 80 a. Conduct a hypothesis test to determine if the proportion of traffic accidents is the same for each day of the week. What is the p value? Compute the value of the test...
 please complete A and B
Chi-square Problems 1. The National Highway Traffic Safety Administration publishes reports about motorcycle fatalities and helmet use. The distribution below shows the proportion of fatalities by location of injury for motorcycle accidents. Location of Injury Multiple location Head Proportion 0.57 0.31 Neck 0.03 Thorax 0.06 Abdomen/Lumbar/Spine 0.03 Data below show the location of injury and fatalities for 2068 riders not wearing a helmet. Location of Injury Multiple location Head Number 1036 864 38 83 Neck...
please complete A and B
Chi-square Problems 1. The National Highway Traffic Safety Administration publishes reports about motorcycle fatalities and helmet use. The distribution below shows the proportion of fatalities by location of injury for motorcycle accidents. Location of Injury Multiple location Head Proportion 0.57 0.31 Neck 0.03 Thorax 0.06 Abdomen/Lumbar/Spine 0.03 Data below show the location of injury and fatalities for 2068 riders not wearing a helmet. Location of Injury Multiple location Head Number 1036 864 38 83 Neck...
 Previous Problem Problem List Next Problem (1 point) The U.S. National Highway Traffic Safety Administration gathers data concerning the causes of highway crashes where at least one fatality has occurred. From the 1998 annual study, the following probabilities were determined (BAC is blood-alcohol level): P(BAC =0|Crash with fatality) = 0.613 P(BAC is between .01 and .09|Crash with fatality) = 0.335 P(BAC is greater than .09|Crash with fatality) = 0.054 Suppose over a certain stretch of highway during a 1-year period,...
 The National Highway Traffic Safety Administration reported the percentage of traffic accidents occurring each day of the week. Assume that a sample of 420 acdldents provided the following data. Sunday Monday Tuesday Wednesday Thursday Friday Saturday 50 64 48 56 53 70 9 a. Conduct a hypothesis test to determine if the proportion of traffic accidents is the same for each day of the week. What is the p-value? Compute the value of the ?2 test statistic (to 3 decimals)....
 The National Highway Traffic Safety Administration reported the percentage of traffic accidents occurring each day of the week. Assume that a sample of 420 accidents provided the following data Sunday Monday Tues day Wednesday Thursday riday Saturday 50 53 47 69 (a) Conduct a hypothesis test to determine if the proportion of traffic accidents is the same for each day of the week. Use a 0.05 level of significance. State the null and alternative hypotheses. Ho: Not all proportions are...
 The U.S. Department of Transportation, National Highway
Traffic Safety Administration, reported that 77% of all fatally
injured automobile drivers were intoxicated. A random sample of 28
records of automobile driver fatalities in Kit Carson County,
Colorado, showed that 14 involved an intoxicated driver. Do these
data indicate that the population proportion of driver fatalities
related to alcohol is less than 77% in Kit Carson County? Use α =
0.01. Solve the problem using both the traditional method and the
P-value...
The U.S. Department of Transportation, National Highway
Traffic Safety Administration, reported that 77% of all fatally
injured automobile drivers were intoxicated. A random sample of 28
records of automobile driver fatalities in Kit Carson County,
Colorado, showed that 14 involved an intoxicated driver. Do these
data indicate that the population proportion of driver fatalities
related to alcohol is less than 77% in Kit Carson County? Use α =
0.01. Solve the problem using both the traditional method and the
P-value...
 thanks for your help
The National Highway Traffic Safety Administration reported the percentage of traffic accidents occurring each day of the week. Assume that a sample of 420 accidents provided the following data Sunday Monday Tuesday Wednesday Thursday Friday Saturday 65 52 54 45 52 72 80 a. Conduct a hypothesis test to determine if the proportion of traffic accidents is the same for each day of the week. What is the p value? Compute the value of the test...
thanks for your help
The National Highway Traffic Safety Administration reported the percentage of traffic accidents occurring each day of the week. Assume that a sample of 420 accidents provided the following data Sunday Monday Tuesday Wednesday Thursday Friday Saturday 65 52 54 45 52 72 80 a. Conduct a hypothesis test to determine if the proportion of traffic accidents is the same for each day of the week. What is the p value? Compute the value of the test...
Most questions answered within 3 hours.
-
Other decisions about scientific claims can have a much broader
impact.ENERGYarrow-10x10.png, environment, health, security - all...
asked 31 minutes ago -
I need to write a research paper and work cited about this
topic: The United States...
asked 54 minutes ago -
Hello! I was wondering if I could have some help?
If the vapor pressure of carvone...
asked 1 hour ago -
An economist wants to estimate the mean per capita income (in
thousands of dollars) for a...
asked 1 hour ago -
What would be the input/output characteristic of a circuit
obtained by putting two of your 2's-complementers...
asked 1 hour ago -
In Drosophila, the transition from the syncytial blastoderm
stage to the cellular blastoderm stage is a...
asked 2 hours ago -
Project management question:
Name 3 different types of resources (hint: humans are one
type)
asked 2 hours ago -
Consider the following reaction: C 2H 2( g) + 2H 2( g) C 2H 6(
g)...
asked 2 hours ago -
Consider a 1.0 L buffer containing 0.092 mol L-1 HCOOH and 0.100
mol L-1 HCOO-. What...
asked 2 hours ago -
Koch Realty has owned a vacant land with a FMV of
$775,000 and an adjusted basis...
asked 2 hours ago -
It is estimated 29% of all adults in United States invest in
stocks and that 85%...
asked 2 hours ago -
What does a 2-sided p value of 0.04 mean? (I am not asking if it
is...
asked 2 hours ago