
Homework Answers


Add Answer to:
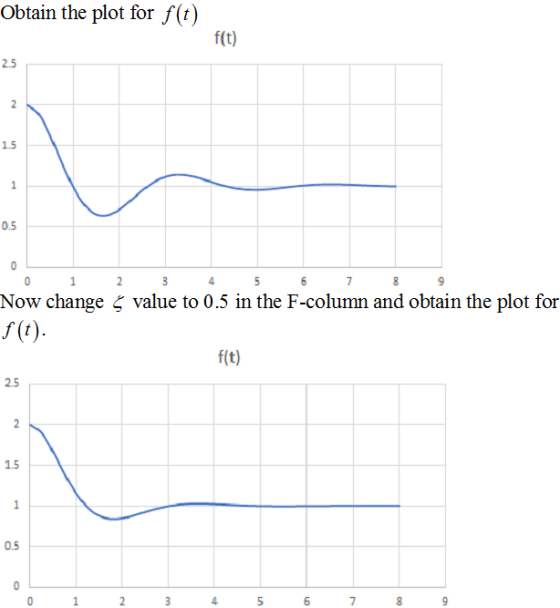
For transform #22 shown below, given S-03, A-1, and on-2, use Excel to graph ft) from...
1)Fill in the table given below, then drax a graph In (Na2S2O3] versus time(in seconds) by...
 1)Fill in the table given below, then drax a graph In (Na2S2O3] versus time(in seconds) by using excel. (20p) In Na 8,03] t(seconds) -1.02 0 - 1.20 900 -1.39 1800 -1.66 2880 -2.04 4500 In (Na2S0203) vs. Time(s) 0 1000 2000 3000 4000 5000 -0.5 -1 In (Na2S0203) -1.5 -2 -2.5 Time (s) 2) Fill in the table given below,then draw a graph of excel. (20p) versus time (in seconds) by using [Na2S2031 t(seconds) Na,,03] 2.78 3.33 4 5.26 7.69...
Follow the directions below to create an Excel graph for a perfectly competitive company. A company...
 Follow the directions below to create an Excel graph for a perfectly competitive company. A company has total costs of 200+ 2000 - 2.5Q++ 1/3Q'. The price per unit is $500. Use excel to create a table to solve the problem as in question 5. Add two columns for average total costs and average variable costs. Create a graph for quantities from 1 to 25 that has ATC, AVC, MC, and MR on it. . Give the graph a title...
The graph of f(t) is given below. 3 2 y 1 0 2 4 6 8...
 The graph of f(t) is given below. 3 2 y 1 0 2 4 6 8 10 1 Find the Laplace transform F(s) = L{f(t)} by first expressing f(t) in terms of the Heaviside function. + -38 - 2745) + { (-32–35 –e-4-2-95) Correct Answer: C4 (8-38-2-45) – e-95) Your Mark: 0/2 Attempt #1 Attempt #2 Attempt #3 Attempt #4 Attempt #5 roblem #12 Your Answer: Žice+38–245) + { (+38738_e=4 e-95) Your Mark: 0/2x
0, The height of an object, H, In fee is given in the graph after t...
 0, The height of an object, H, In fee is given in the graph after t second have passed. In the graph the dependent variable is the height of the object in feet, and the independent variable is the number of seconds after it has been launched in the air. H(0) sentence that gives the real world meaning of the calculation) solve or evaluate and then write a complete H(t)-0 (solve or evaluate and then write a complete sentence that...
Problem #9: The graph of f(t) is given below. 5 4 3 2 2 10 4 -1 1 (a) f() can be represented using the following combin...
 Problem #9: The graph of f(t) is given below. 5 4 3 2 2 10 4 -1 1 (a) f() can be represented using the following combination of Heaviside step functions а U(t - 3) + b U(t - 4) + с U(t - 9) Enter the constants a, b, and c (in that order) into the answer box below. (b) Find the Laplace transform F(s) = Pf()} for s 0. a, b, c (in that order), separated with commas....
Question 8: 1. Redraw the circuit shown below with the s domain equivalent models, where V1(t)...
 Question 8: 1. Redraw the circuit shown below with the s domain equivalent models, where V1(t) is a step function from 0 to 1V at t-0 2. Find transfer function in the s domain H( 3. Write the s-domain equation for Vout(s) if V1(s) is a 1V step function. 4. Write the equation of r of the circuit in terms of R's and C 5. Write the equation for the step response in the time domain. 6. You can either...
1. (2 pts each) The graph of some unknown function f is given below. 10 6/ 8-64-2 624 10 12 Use the graph to estimate the following quantities: (0 f (9) (g) f(4) b) lim (a) lim (e) (d) lim ( 6)...
 1. (2 pts each) The graph of some unknown function f is given below. 10 6/ 8-64-2 624 10 12 Use the graph to estimate the following quantities: (0 f (9) (g) f(4) b) lim (a) lim (e) (d) lim ( 6) (e) lim f(x) (c) lim f(x) if g(x)f(x) 6) a value of r where f is continuous but not differentiable (k) a value of r where f"(x) 0 and f"(x)>0 (1) the location of a relative maximum value...
1. Use combinations of STEP FUNCTIONS to describe each continuous-time signal shown below. f(t) 0 2...
 1. Use combinations of STEP FUNCTIONS to describe each continuous-time signal shown below. f(t) 0 2 4 6 0 1 2 3 0 1 2 3 4 2. Sketch the following signals: (a) x (t)=1 [u(t+2)-u(t-1)] (c) X(t)=\fety (b) X(t)=t.e (d) x (t) = u(t) u(t-1).ult-2).u(t-3) 3. Determine whether the systems below are linear and time invariant. Justify your answer! (a) y(t) = x(31) (b) y(t)= 2x(1-t) y(t)=cos(x(t)] 4. Simplify the expressions: (a) y(t)=1.8(t+2)+(t +1) 8(1-1)+(t+3). 8(t) (b) y(t) =...
I need someone to help answer table 1 only mass, volume, y density and table 2...
 I need someone to help answer table 1 only mass,
volume, y density and table 2 with a graph each table.
please read the procesures, thank you
Experiment 2 Graphing and Measurements Graphs summarize numerical data efficiently and are usually casier to understand and interpret than columns of numbers. In this experiment, you will collect data and construct a graph that makes an effective visual presentation. Materials: Equipment metric ruler Chemical a kit with 5 pieces Procedure: Part I: Measurements...
I need someone to help answer table 1 only mass,
volume, y density and table 2 with a graph each table.
please read the procesures, thank you
Experiment 2 Graphing and Measurements Graphs summarize numerical data efficiently and are usually casier to understand and interpret than columns of numbers. In this experiment, you will collect data and construct a graph that makes an effective visual presentation. Materials: Equipment metric ruler Chemical a kit with 5 pieces Procedure: Part I: Measurements...
(1 point) A stone is thrown from a rooftop at time t 0 seconds. Its position at time t (the components are measured in meters) is given by r()-бі-50+ (24.5-49:2) k. The origin is at the base of...
 (1 point) A stone is thrown from a rooftop at time t 0 seconds. Its position at time t (the components are measured in meters) is given by r()-бі-50+ (24.5-49:2) k. The origin is at the base of the bulding, which is standing on flat ground. Distance is measured in meters. The vector i points east,j points north, and k points up. (a) How high is the rooftop? meters. (b) When does the stone hit the ground? seconds (c) Where...
 1)Fill in the table given below, then drax a graph In (Na2S2O3] versus time(in seconds) by using excel. (20p) In Na 8,03] t(seconds) -1.02 0 - 1.20 900 -1.39 1800 -1.66 2880 -2.04 4500 In (Na2S0203) vs. Time(s) 0 1000 2000 3000 4000 5000 -0.5 -1 In (Na2S0203) -1.5 -2 -2.5 Time (s) 2) Fill in the table given below,then draw a graph of excel. (20p) versus time (in seconds) by using [Na2S2031 t(seconds) Na,,03] 2.78 3.33 4 5.26 7.69...
 Follow the directions below to create an Excel graph for a perfectly competitive company. A company has total costs of 200+ 2000 - 2.5Q++ 1/3Q'. The price per unit is $500. Use excel to create a table to solve the problem as in question 5. Add two columns for average total costs and average variable costs. Create a graph for quantities from 1 to 25 that has ATC, AVC, MC, and MR on it. . Give the graph a title...
 The graph of f(t) is given below. 3 2 y 1 0 2 4 6 8 10 1 Find the Laplace transform F(s) = L{f(t)} by first expressing f(t) in terms of the Heaviside function. + -38 - 2745) + { (-32–35 –e-4-2-95) Correct Answer: C4 (8-38-2-45) – e-95) Your Mark: 0/2 Attempt #1 Attempt #2 Attempt #3 Attempt #4 Attempt #5 roblem #12 Your Answer: Žice+38–245) + { (+38738_e=4 e-95) Your Mark: 0/2x
 0, The height of an object, H, In fee is given in the graph after t second have passed. In the graph the dependent variable is the height of the object in feet, and the independent variable is the number of seconds after it has been launched in the air. H(0) sentence that gives the real world meaning of the calculation) solve or evaluate and then write a complete H(t)-0 (solve or evaluate and then write a complete sentence that...
 Problem #9: The graph of f(t) is given below. 5 4 3 2 2 10 4 -1 1 (a) f() can be represented using the following combination of Heaviside step functions а U(t - 3) + b U(t - 4) + с U(t - 9) Enter the constants a, b, and c (in that order) into the answer box below. (b) Find the Laplace transform F(s) = Pf()} for s 0. a, b, c (in that order), separated with commas....
 Question 8: 1. Redraw the circuit shown below with the s domain equivalent models, where V1(t) is a step function from 0 to 1V at t-0 2. Find transfer function in the s domain H( 3. Write the s-domain equation for Vout(s) if V1(s) is a 1V step function. 4. Write the equation of r of the circuit in terms of R's and C 5. Write the equation for the step response in the time domain. 6. You can either...
 1. (2 pts each) The graph of some unknown function f is given below. 10 6/ 8-64-2 624 10 12 Use the graph to estimate the following quantities: (0 f (9) (g) f(4) b) lim (a) lim (e) (d) lim ( 6) (e) lim f(x) (c) lim f(x) if g(x)f(x) 6) a value of r where f is continuous but not differentiable (k) a value of r where f"(x) 0 and f"(x)>0 (1) the location of a relative maximum value...
 1. Use combinations of STEP FUNCTIONS to describe each continuous-time signal shown below. f(t) 0 2 4 6 0 1 2 3 0 1 2 3 4 2. Sketch the following signals: (a) x (t)=1 [u(t+2)-u(t-1)] (c) X(t)=\fety (b) X(t)=t.e (d) x (t) = u(t) u(t-1).ult-2).u(t-3) 3. Determine whether the systems below are linear and time invariant. Justify your answer! (a) y(t) = x(31) (b) y(t)= 2x(1-t) y(t)=cos(x(t)] 4. Simplify the expressions: (a) y(t)=1.8(t+2)+(t +1) 8(1-1)+(t+3). 8(t) (b) y(t) =...
 I need someone to help answer table 1 only mass,
volume, y density and table 2 with a graph each table.
please read the procesures, thank you
Experiment 2 Graphing and Measurements Graphs summarize numerical data efficiently and are usually casier to understand and interpret than columns of numbers. In this experiment, you will collect data and construct a graph that makes an effective visual presentation. Materials: Equipment metric ruler Chemical a kit with 5 pieces Procedure: Part I: Measurements...
I need someone to help answer table 1 only mass,
volume, y density and table 2 with a graph each table.
please read the procesures, thank you
Experiment 2 Graphing and Measurements Graphs summarize numerical data efficiently and are usually casier to understand and interpret than columns of numbers. In this experiment, you will collect data and construct a graph that makes an effective visual presentation. Materials: Equipment metric ruler Chemical a kit with 5 pieces Procedure: Part I: Measurements...
 (1 point) A stone is thrown from a rooftop at time t 0 seconds. Its position at time t (the components are measured in meters) is given by r()-бі-50+ (24.5-49:2) k. The origin is at the base of the bulding, which is standing on flat ground. Distance is measured in meters. The vector i points east,j points north, and k points up. (a) How high is the rooftop? meters. (b) When does the stone hit the ground? seconds (c) Where...
Most questions answered within 3 hours.
-
A pair of fair dice is tossed. Let X denote the larger of the
two numbers...
asked 33 seconds from now -
What are the variety of forms of products dispensed with aerosol
spray?
asked 3 minutes ago -
Which one of the following statements is true about C++
keywords?
a. A keyword can have...
asked 4 minutes ago -
Pyruvate Kinase, an allosteric enzyme, accelerates the
conversion of phosphoenolpyruvate to pyruvate.
1) Draw curves describing...
asked 6 minutes ago -
question 1
Which of the following is an example of a bottom-up technique
for developing promotional...
asked 23 minutes ago -
1)In FM modulation, what aspect of the carrier is being
modulated?
2)Explain in your own words,...
asked 20 minutes ago -
Andromeda Galaxy, M31, is considered a sister galaxy to Milky
Way galaxy. One similarirty is their...
asked 25 minutes ago -
How does temperature affect ADH during enzyme
kinetics?
asked 33 minutes ago -
A $1000 par value convertible bond has a conversion price of
$25. It is currently selling...
asked 41 minutes ago -
Write a java program that declares 10 element array (of type
integers), creates and initializes the...
asked 39 minutes ago -
import java.util.Arrays;
import java.util.Random;
import java.util.Scanner;
/**
* TODO Write a summary of the role of...
asked 44 minutes ago -
Sodium hydroxide is a strong base and ammonium hydroxide is a
weak base. Which of the...
asked 50 minutes ago