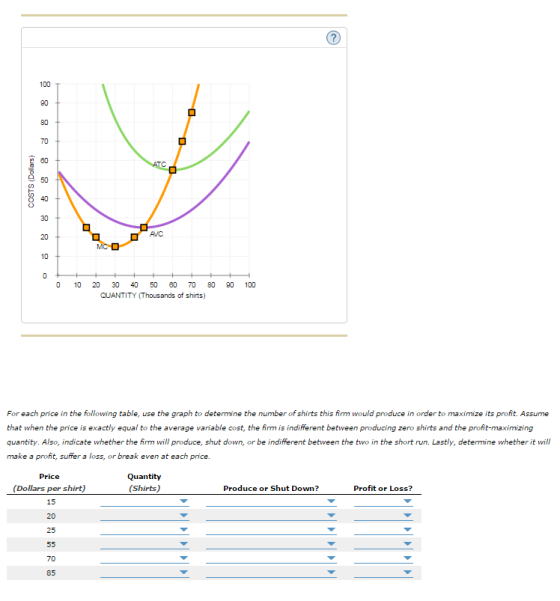
Consider the competitive market for dress shirts. The following graph shows the marginal cost (MC), average total cost (ATC), and average variable cost (AVC) curves for a typical firm in the industry.
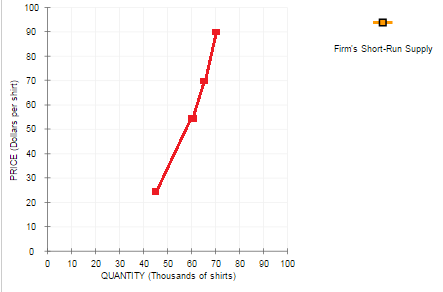
On the following graph, use the orange points (square symbol) to plot points along the portion of the firm's short-run supply curve that corresponds to prices where there is positive output. (Note: You are given more points to plot than you need.)
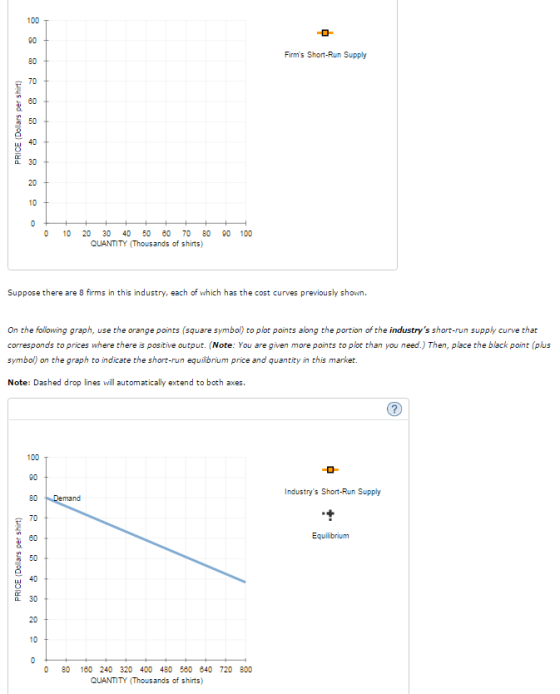
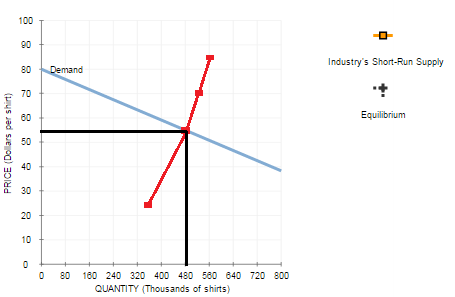
At the current short-run market price, firms will(produce/shut down) in the short run. In the long run, (firms will neither enter nor exit/some firms will enter/some firms will exit)
Homework Answers
Set P=MC
The firm will not produce when P When there are 8 firms,they will supply P Q 25 360000 55 480000 70 520000 85 560000 At the current short-run market price, firms
will(produce) in the short run. In the long run,
(firms will neither enter nor
exit)
P
Q
P/S
P/L
15
0
S
L
20
0
S
L
25
Either 0
or 45000
Either S
or P
L
55
60000
P
Breakeven
70
65000
P
P
85
70000
P
P
Add Answer to:
Consider the competitive market for dress shirts. The following
graph shows the marginal cost (MC), average...
Consider the competitive market for dress shirts. The foflowinggrapit shows the marginal cost (MC), average...
 Consider the competitive market for dress shirts. The following
graphic shows the marginal cost (MC), average total cost (ATC) , and
average variable cost (AVC) curves for a typical industry For each price in the following table, use the graph to determine the number of shirts this firm would produce in order to maximize its profit. Assume that when the price is exactly equal to the average variable cost, the firm is Indifferent between producing zero shirts and the profit-maximizing quantity....
Consider the competitive market for dress shirts. The following
graphic shows the marginal cost (MC), average total cost (ATC) , and
average variable cost (AVC) curves for a typical industry For each price in the following table, use the graph to determine the number of shirts this firm would produce in order to maximize its profit. Assume that when the price is exactly equal to the average variable cost, the firm is Indifferent between producing zero shirts and the profit-maximizing quantity....
17. Deriving the short-run supply curve Consider the competitive market for dress shirts. The following graph shows the marginal cost (MC)
 17. Deriving the short-run supply curve Consider the competitive market for dress shirts. The following graph shows the marginal cost (MC), average total cost (ATC), and average variable cost (AVC) curves for a typical firm in the industry. For each price in the following table, use the graph to determine the number of shirts this firm would produce in order to maximize its profit. Assume that when the price is exactly equal to the average variable cost, the firm is indifferent between...
4. Deriving the short-run supply curve Consider the perfectly competitive market for dress shirts. The following graph...
 4. Deriving the short-run supply curve Consider the perfectly competitive market for dress shirts. The following graph shows the marginal cost (MC), average total cost (ATC), and average variable cost (AVC) curves for a typical firm in the industry. that when the price is exactly equal to the average variable cost, the firm is indifferent between producing zero shirts and the profit-maximizing quantity. Also, indicate whether the firm will produce, shut down, or be indifferent between the two in the short run....
5. Deriving the short-run supply curve Consider the perfectly competitive market for dress shirts. The following...
 5. Deriving the short-run supply curve Consider the perfectly competitive market for dress shirts. The following graph shows the marginal cost (MC), average total cost (ATC), and average variable cost (AVC) curves for a typical firm in the industry. ? 80 72 64 56 40 АТС AVC 8 МС О 0 8 16 24 32 40 48 56 64 72 80 QUANTITY OF OUTPUT (Thousands of shirts) PRICE AND COST PER UNIT (Dollars) For each price in the following table,...
Consider the competitive market for halogen lamps. The following graph shows the marginal cost (MC)
 4. Deriving the short-run supply curve Consider the competitive market for halogen lamps. The following graph shows the marginal cost (MC), average total cost (ATC), and average variable cost (AVC) curves for a typical firm in the industry. For each price in the following table, use the graph to determine the number of lamps this firm would produce in order to maximize its profit. Assume that when the price is exactly equal to the average variable cost, the firm is indifferent between...
Consider the competitive market for halogen lamps. The following graph shows the marginal cost (MC), average total cost (ATC), and average variable cost (AVC) curves for a typical firm in the industry.
 Consider the competitive market for halogen lamps. The following graph shows the marginal cost (MC), average total cost (ATC), and average variable cost (AVC) curves for a typical firm in the industry. For each price in the following table, use the graph to determine the number of lamps this firm would produce in order to maximize its profit. Assume that when the price is exactly equal to the average variable cost, the firm is indifferent between producing zero lamps and the...
PLEASE READ VERY CAREFULLY!! ANSWERS MUST BE CORRECT AND CLEAR TO READ. AND FOR THE GRAPH...
 PLEASE READ VERY CAREFULLY!! ANSWERS MUST BE CORRECT AND CLEAR
TO READ. AND FOR THE GRAPH PLEASE LIST OUT ALL THE COORDINATE
POINTS!! THANKS!
PRODUCE OR SHUTDOWN OPTIONS"
EITHER SHUT DOWN OR PRODUCE
PRODUCE
SHUTDOWN
IN THE LONG RUN: FIRMS WILL NEITHER ENTER NOR
EXIT
SOME FIRMS WILL ENTER
SOME SOME FIRMS WILL EXIT
5. Deriving the short-run supply curve Consider the price-taker market for dress shirts. The following graph shows the marginal cost (MC), average total cost (ATC), and...
PLEASE READ VERY CAREFULLY!! ANSWERS MUST BE CORRECT AND CLEAR
TO READ. AND FOR THE GRAPH PLEASE LIST OUT ALL THE COORDINATE
POINTS!! THANKS!
PRODUCE OR SHUTDOWN OPTIONS"
EITHER SHUT DOWN OR PRODUCE
PRODUCE
SHUTDOWN
IN THE LONG RUN: FIRMS WILL NEITHER ENTER NOR
EXIT
SOME FIRMS WILL ENTER
SOME SOME FIRMS WILL EXIT
5. Deriving the short-run supply curve Consider the price-taker market for dress shirts. The following graph shows the marginal cost (MC), average total cost (ATC), and...
Consider the perfectly competitive market for sports jackets. The following graph shows the marginal cost (MC),...
 Consider the perfectly competitive market for sports jackets. The following graph shows the marginal cost (MC), average total cost (ATC), and average variable cost (AVC) curves for a typical firm in the industry. For each price in the following table, use the graph to determine the number of jackets this firm would produce in order to maximize its profit. Assume that when the price is exactly equal to the average variable cost, the firm is indifferent between producing zero jackets and...
Deriving the short-run supply curve Consider the competitive market for halogen lamps. The following graph shows...
 Deriving the short-run supply curve
Consider the competitive market for halogen lamps. The following
graph shows the marginal cost (MC), average total cost (ATC), and
average variable cost (AVC) curves for a typical firm in the
industry.
For each price in the following table, use the graph to
determine the number of lamps this firm would produce in order to
maximize its profit. Assume that when the price is exactly equal to
the average variable cost, the firm is indifferent...
Deriving the short-run supply curve
Consider the competitive market for halogen lamps. The following
graph shows the marginal cost (MC), average total cost (ATC), and
average variable cost (AVC) curves for a typical firm in the
industry.
For each price in the following table, use the graph to
determine the number of lamps this firm would produce in order to
maximize its profit. Assume that when the price is exactly equal to
the average variable cost, the firm is indifferent...
6. Deriving the short-run supply curve Consider the competitive market for halogen lamps. The following graph...
 6. Deriving the short-run supply curve Consider the competitive market for halogen lamps. The following graph shows the marginal cost (MC), average total cost (ATC), and average variable cost (AVC) curves for a typical firm in the industry. ATC COSTS (Dollars) MC D 0 + 0 + + + + + 20 30 40 50 60 70 80 QUANTITY (Thousands of lamps) + 90 10 100 For each price in the following table, use the graph to determine the number...
 5. Deriving the short-run supply curve Consider the perfectly competitive market for dress shirts. The following graph shows the marginal cost (MC), average total cost (ATC), and average variable cost (AVC) curves for a typical firm in the industry. ? 80 72 64 56 40 АТС AVC 8 МС О 0 8 16 24 32 40 48 56 64 72 80 QUANTITY OF OUTPUT (Thousands of shirts) PRICE AND COST PER UNIT (Dollars) For each price in the following table,...
 PLEASE READ VERY CAREFULLY!! ANSWERS MUST BE CORRECT AND CLEAR
TO READ. AND FOR THE GRAPH PLEASE LIST OUT ALL THE COORDINATE
POINTS!! THANKS!
PRODUCE OR SHUTDOWN OPTIONS"
EITHER SHUT DOWN OR PRODUCE
PRODUCE
SHUTDOWN
IN THE LONG RUN: FIRMS WILL NEITHER ENTER NOR
EXIT
SOME FIRMS WILL ENTER
SOME SOME FIRMS WILL EXIT
5. Deriving the short-run supply curve Consider the price-taker market for dress shirts. The following graph shows the marginal cost (MC), average total cost (ATC), and...
PLEASE READ VERY CAREFULLY!! ANSWERS MUST BE CORRECT AND CLEAR
TO READ. AND FOR THE GRAPH PLEASE LIST OUT ALL THE COORDINATE
POINTS!! THANKS!
PRODUCE OR SHUTDOWN OPTIONS"
EITHER SHUT DOWN OR PRODUCE
PRODUCE
SHUTDOWN
IN THE LONG RUN: FIRMS WILL NEITHER ENTER NOR
EXIT
SOME FIRMS WILL ENTER
SOME SOME FIRMS WILL EXIT
5. Deriving the short-run supply curve Consider the price-taker market for dress shirts. The following graph shows the marginal cost (MC), average total cost (ATC), and...
 Deriving the short-run supply curve
Consider the competitive market for halogen lamps. The following
graph shows the marginal cost (MC), average total cost (ATC), and
average variable cost (AVC) curves for a typical firm in the
industry.
For each price in the following table, use the graph to
determine the number of lamps this firm would produce in order to
maximize its profit. Assume that when the price is exactly equal to
the average variable cost, the firm is indifferent...
Deriving the short-run supply curve
Consider the competitive market for halogen lamps. The following
graph shows the marginal cost (MC), average total cost (ATC), and
average variable cost (AVC) curves for a typical firm in the
industry.
For each price in the following table, use the graph to
determine the number of lamps this firm would produce in order to
maximize its profit. Assume that when the price is exactly equal to
the average variable cost, the firm is indifferent...
 6. Deriving the short-run supply curve Consider the competitive market for halogen lamps. The following graph shows the marginal cost (MC), average total cost (ATC), and average variable cost (AVC) curves for a typical firm in the industry. ATC COSTS (Dollars) MC D 0 + 0 + + + + + 20 30 40 50 60 70 80 QUANTITY (Thousands of lamps) + 90 10 100 For each price in the following table, use the graph to determine the number...
Most questions answered within 3 hours.
-
4. Without doing any calculations, predict whether the observed
∆T would increase, decrease or remain the...
asked 6 minutes ago -
Based on the range, which of the following sets of scores has
the greatest variability? 3,...
asked 1 hour ago -
Ripples in a pond travel at a velocity of 3 m/s with one peak
passing a...
asked 1 hour ago -
A man stands on the roof of a building of height 13.0 mm and
throws a...
asked 1 hour ago -
The extent to which assets are financed by borrowed funds and
other liabilities is indicated by:...
asked 2 hours ago -
Explain in detail
Germany is the fifth largest economy
explain what goods and services Germany specializes...
asked 2 hours ago -
The density of platinum is 21.45 g/mL. If a cube of platinum
with a mass of...
asked 2 hours ago -
Accounts Receivable
Sales
A/R Posting
Extended Sales Invoice
Packing Slip
Compare invoice to packing slip 2...
asked 2 hours ago -
Michaella, age 23, is a full-time law student and is claimed by
her parents as a...
asked 2 hours ago -
Why are polymers not typically casted into products?
asked 2 hours ago -
When rolling a die 129 times, what is the probability of rolling
a 6 no more...
asked 3 hours ago -
4. A call option currently sells for $7.75. It has a strike
price of $85 and...
asked 2 hours ago