You may need to use the appropriate appendix table or technology to answer this question. The...
You may need to use the appropriate appendix table or technology to answer this question.
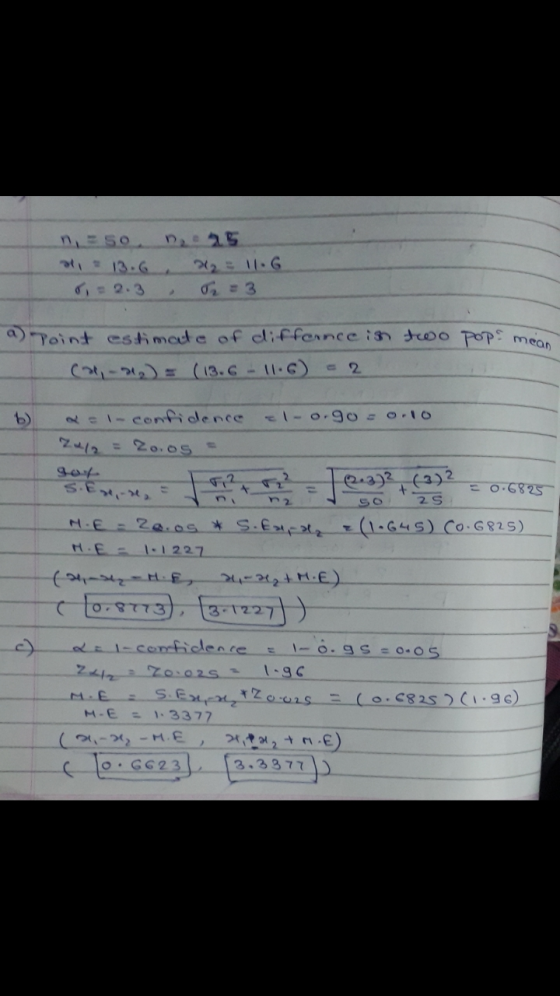
The following results come from two independent random samples taken of two populations.
| Sample 1 | Sample 2 |
|---|---|
|
n1 = 50 |
n2 = 25 |
|
x1 = 13.6 |
x2 = 11.6 |
|
σ1 = 2.3 |
σ2 = 3 |
(a)
What is the point estimate of the difference between the two population means? (Use
x1 − x2.)
(b)
Provide a 90% confidence interval for the difference between the two population means. (Use
x1 − x2.
Round your answers to two decimal places.)
to
(c)
Provide a 95% confidence interval for the difference between the two population means. (Use
x1 − x2.
Round your answers to two decimal places.)
to
Homework Answers
Add Answer to:
You may need to use the appropriate appendix table or technology
to answer this question.
The...
You may need to use the appropriate appendix table or technology to answer this question. The...
 You may need to use the appropriate appendix table or technology to answer this question. The following results come from two independent random samples taken of two populations. Sample 1 Sample 2 ni = 50 n2 = 35 X1 = 13.6 X2 = 11.6 9 = 2.4 92 = 3 (a) What is the point estimate of the difference between the two population means? (Use - x2) (b) Provide a 90% confidence interval for the difference between the two population...
You may need to use the appropriate appendix table or technology to answer this question. The...
You may need to use the appropriate appendix table or technology to answer this question. The following results are for independent random samples taken from two populations. Sample 1 Sample 2 n1 = 20 n2 = 30 x1 = 22.8 x2 = 20.1 s1 = 2.2 s2 = 4.6 (a) What is the point estimate of the difference between the two population means? (Use x1 − x2. ) 2.7 (b) What is the degrees of freedom for the t distribution?...
You may need to use the appropriate appendix table or technology to answer this question. Consider...
You may need to use the appropriate appendix table or technology to answer this question. Consider the following hypothesis test. H0: μ1 − μ2 = 0 Ha: μ1 − μ2 ≠ 0 The following results are for two independent samples taken from the two populations. Sample 1 Sample 2 n1 = 80 n2 = 70 x1 = 104 x2 = 106 σ1 = 8.2 σ2 = 7.4 (a) What is the value of the test statistic? (Round your answer to...
You may need to use the appropriate appendix table or technology to answer this question. Consider...
You may need to use the appropriate appendix table or technology to answer this question. Consider the following results for independent samples taken from two populations. Sample 1 Sample 2 n1 = 400 n2 = 300 p1 = 0.49 p2 = 0.34 (a) What is the point estimate of the difference between the two population proportions? (Use p1 − p2. ) (b) Develop a 90% confidence interval for the difference between the two population proportions. (Use p1 − p2. Round...
You may need to use the appropriate appendix table or technology to answer this question Consider...
 You may need to use the appropriate appendix table or technology to answer this question Consider the following data for two independent random samples taken from two normal populations Sample 1 10 71479 7 Sample 29 783 6 9 (a) Compute the two sample means Sample 1 9 Sample 2 7 (b) Compute the two sample standard deviations. (Round your answers to two decimal places.) Sample 1 Sample 2 2.51 2.08 (c) What is the point estimate of the difference...
My Notes You may need to use the appropriate appendix table or technology to answer this...
 My Notes You may need to use the appropriate appendix table or technology to answer this question. The following results are for independent random samples taken from two populations. Sample 1 Sample 2 ₂ = 20 | n₂ = 30 * - 22.7 -20.1 $1 = 2.2 $2 = 4.8 (a) What is the point estimate of the difference between the two population means? (Use x - ) 25 (b) What is the degrees of freedom for the distribution? (Round...
You may need to use the appropriate appendix table or technology to answer this question Consider the following data for two independent random samples taken from two normal populations Sample 1 107...
 You may need to use the appropriate appendix table or technology to answer this question Consider the following data for two independent random samples taken from two normal populations Sample 1 107 146 9 8 Sample 28784510 (a) Compute the two sample means. Sample 1 Sample 2 (b) Compute the two sample standard deviations. (Round your answers to two decimal places.) Sample 1 Sample 2 (c) What is the point estimate of the difference between the two population means? (Use...
You may need to use the appropriate appendix table or technology to answer this question. Sales...
 You may need to use the appropriate appendix table or technology to answer this question. Sales personnel for Skillings Distributors submit weekly reports listing the customer contacts made during the week. A sample of 67 weekly reports showed a sample mean of 19.5 customer contacts per week. The sample standard deviation was 5.2. Provide a 90% confidence interval for the population mean number of weekly customer contacts for the sales personnel. (Round your answers to two decimal places.) contacts/week to...
You may need to use the appropriate appendix table or technology to answer this question. A...
 You may need to use the appropriate appendix table or technology to answer this question. A magazine conducts an annual survey in which readers rate their favorite cruise ship. All ships are rated on a 100-point scale, with higher values indicating better service. A sample of 39 ships that carry fewer than 500 passengers resulted in an average rating of 85.67, and a sample of 44 ships that carry 500 or more passengers provided an average rating of 81.70. Assume...
You may need to use the appropriate appendix table or technology to answer this question A...
 You may need to use the appropriate appendix table or technology to answer this question A center for education statistics reported that 44% of college students work to pay for tuition and living expenses. Assume that a sample of 440 college students was used in the study (a) Provide a 95% confidence interval for the population proportion of college students who work to pay for tuition and living expenses. (Round your answers to four decimal places.) (b) Provide a 99%...
 You may need to use the appropriate appendix table or technology to answer this question. The following results come from two independent random samples taken of two populations. Sample 1 Sample 2 ni = 50 n2 = 35 X1 = 13.6 X2 = 11.6 9 = 2.4 92 = 3 (a) What is the point estimate of the difference between the two population means? (Use - x2) (b) Provide a 90% confidence interval for the difference between the two population...
 You may need to use the appropriate appendix table or technology to answer this question Consider the following data for two independent random samples taken from two normal populations Sample 1 10 71479 7 Sample 29 783 6 9 (a) Compute the two sample means Sample 1 9 Sample 2 7 (b) Compute the two sample standard deviations. (Round your answers to two decimal places.) Sample 1 Sample 2 2.51 2.08 (c) What is the point estimate of the difference...
 My Notes You may need to use the appropriate appendix table or technology to answer this question. The following results are for independent random samples taken from two populations. Sample 1 Sample 2 ₂ = 20 | n₂ = 30 * - 22.7 -20.1 $1 = 2.2 $2 = 4.8 (a) What is the point estimate of the difference between the two population means? (Use x - ) 25 (b) What is the degrees of freedom for the distribution? (Round...
 You may need to use the appropriate appendix table or technology to answer this question Consider the following data for two independent random samples taken from two normal populations Sample 1 107 146 9 8 Sample 28784510 (a) Compute the two sample means. Sample 1 Sample 2 (b) Compute the two sample standard deviations. (Round your answers to two decimal places.) Sample 1 Sample 2 (c) What is the point estimate of the difference between the two population means? (Use...
 You may need to use the appropriate appendix table or technology to answer this question. Sales personnel for Skillings Distributors submit weekly reports listing the customer contacts made during the week. A sample of 67 weekly reports showed a sample mean of 19.5 customer contacts per week. The sample standard deviation was 5.2. Provide a 90% confidence interval for the population mean number of weekly customer contacts for the sales personnel. (Round your answers to two decimal places.) contacts/week to...
 You may need to use the appropriate appendix table or technology to answer this question. A magazine conducts an annual survey in which readers rate their favorite cruise ship. All ships are rated on a 100-point scale, with higher values indicating better service. A sample of 39 ships that carry fewer than 500 passengers resulted in an average rating of 85.67, and a sample of 44 ships that carry 500 or more passengers provided an average rating of 81.70. Assume...
 You may need to use the appropriate appendix table or technology to answer this question A center for education statistics reported that 44% of college students work to pay for tuition and living expenses. Assume that a sample of 440 college students was used in the study (a) Provide a 95% confidence interval for the population proportion of college students who work to pay for tuition and living expenses. (Round your answers to four decimal places.) (b) Provide a 99%...
Most questions answered within 3 hours.
-
Calculate the molality, mole-fraction and percent mass of 28.9M
HF at 25 degrees Celcius of the...
asked 5 minutes ago -
A developmental psychologist believes that children raised in
bilingual families will have higher verbal fluency at...
asked 11 minutes ago -
A fast food meal has 5660 kJ of energy. A person uses energy at
a rate...
asked 23 minutes ago -
The pKb for a generic amine(R-NH2)) in
aqueous solution is 6.30. What is its pKa?
asked 25 minutes ago -
The following reactions have the indicated equilibrium constants
at a particular temperature: N2(g) + O2(g) ⇌...
asked 27 minutes ago -
Please Help ASAP.
1Consider the below code which iterates over a linked
list of n nodes...
asked 43 minutes ago -
Determine the air to fuel ratio of:
Canadian natural gas, with 93.9% methane, 4.2% ethane, 0.3%...
asked 44 minutes ago -
A manufacturer of power tools claims that the average amount of
time required to assemble their...
asked 46 minutes ago -
"electron-withdrawing substituents on carbon encourage back
donation", then on the next page he says that "greater...
asked 57 minutes ago -
On December 31, 2016, the shareholders’ equity section of the
balance sheet of R & L...
asked 1 hour ago -
16.7
At t=0s a small "upward" (positive y) pulse centered at x = 5.0
m is...
asked 1 hour ago -
Twitter Users and News: A poll conducted in 2013 found that 52%
of U.S. adult Twitter...
asked 1 hour ago