A recent article reported that a job awaits only one in three (0.33) new college graduates....
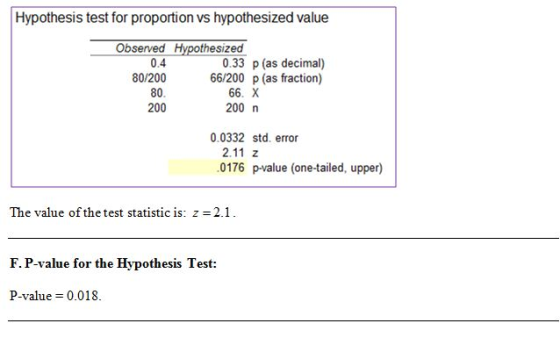
A recent article reported that a job awaits only one in three (0.33) new college graduates. The major reasons given were an overabundance of college graduates and a weak economy. A survey of 200 recent graduates from your school revealed that 80 students had jobs. At the .01 significance level, can we conclude that a larger proportion of students at your school have jobs?
A The Null Hypothesis is:
a Job awaiting new college graduates is _______.
b Job awaiting new college graduates is greater than _______.
c Job awaiting new college graduates is less than _______.
d Job awaiting new college graduates is not equal to _______.
Answer the question by: Selecting the appropriate letter and then entering the correct number for the Null Hypothesis. Enter numerical value of the Null Hypothesis as a fraction or a 2 place decimal with a 0 to the left of the decimal point.. ______ ______
B The Alternate Hypothesis is:
a Job awaiting new college graduates is equal to ______.
b Job awaiting new college graduates is greater than ______.
c Job awaiting new college graduates is less than ______.
d Job awaiting new college graduates is not equal to ______.
Answer the question by: Selecting the appropriate letter and then entering the correct number for the Alternate Hypothesis. Enter numerical value of the Alternate Hypothesis as a fraction or a 2 place decimal with a 0 to the left of the decimal point.. _______ _____
C The appropriate distribution is:
a Uniform Distribution
b Normal Distribution
c t Distribution d Chi Square Distribution
________
The Hypothesis test is a:
a Left tail test
b Right tail test
c Two tail test
Enter the appropriate letters for answering the questions in the same order in which the questions are asked. ______ ______
D Select and enter the letter for the appropriate decision rule. Decision: rule
a Ha hypothesis: If the Pvalue is equal to or greater than the significance level of the test.
b Ha hypothesis: If the Pvalue is equal to or less than the significance level of the test.
c Ho hypothesis: If the Pvalue is equal to or less than the significance level of the test.
______
E The numerical value of the test statistic is: Enter answer rounded to 1 decimal place. ______
F What is the Pvalue for the Hypothesis Test? Enter answer as a decimal rounded to 3 places with a zero to the left of the decimal point. Do not enter answer as a percent. ______
G Hypothesis Test Decision:
a Null Hypothesis: Do not reject the null hypothesis. The data does not support the Alternate Hypothesis.
b Alternate Hypothesis: Reject the null hypothesis. The data supports the Alternate Hypothesis.
c Cannot be determined because the data set is a sample.
Enter the correct answer by selecting the appropriate letter. ______
Homework Answers


Add Answer to:
A recent article reported that a job awaits only one in three
(0.33) new college graduates....
1.A recent article reported that a job awaits only one in three new college graduates. (1...
1.A recent article reported that a job awaits only one in three new college graduates. (1 in 3 means the proportion is .333) A survey of 200 recent graduates revealed that 80 graduates had jobs. At the .02 significance level, we will conduct a hypothesis test to determine if we can conclude if a larger proportion of graduates have jobs than previously reported. What will be the value of our critical value? 2..A recent article reported that a job awaits...
We're interested in the amount of time spent at work by college graduates employed full-time. The...
We're interested in the amount of time spent at work by college graduates employed full-time. The standard amount of time spent at work by full-time employees is 40 hours per week. We suspect that the mean number μ of hours worked per week by college graduates is more than 40 hours and wish to do a statistical test. We select a random sample of 100 college graduates employed full-time and compute the mean number of hours worked per week by...
We're interested in the amount of time spent at work by college graduates employed full-time. The...
 We're interested in the amount of time spent at work by college graduates employed full-time. The standard amount of time spent at work by full-time employees is 40 hours per week. We suspect that the mean number of hours worked per week by college graduates is less than 40 hours and wish to do a statistical test. We select a random sample of 100 college graduates employed full-time and compute the mean number of hours worked per week by the...
Problem 3 The dean of a college is interested in the proportion of graduates from his...
Problem 3 The dean of a college is interested in the proportion of graduates from his college who have a job offer on graduation day. He is particularly interested in seeing if there is a difference in this proportion for accounting and economics majors. In a random sample of 100 of each type of major at graduation, he found that 65 accounting majors and 52 economics majors had job offers. If the accounting majors are designated as "Group 1" and...
Research at the University of Toledo indicates that 50% of students change their major area of...
Research at the University of Toledo indicates that 50% of students change their major area of study after their first year in a program. A random sample of 100 students in the College of Business revealed that 48 had changed their major area of study after their first year of the program. Has there been a significant decrease in the proportion of students who change their major after the first year in this program? Test at the .05 level of...
The dean of a college is interested in the proportion of graduates from his college who...
The dean of a college is interested in the proportion of graduates from his college who have a job offer on graduation day. He is particularly interested in seeing if there is a difference in this proportion for accounting and economics majors. In a random sample of 200 of each type of major at graduation, he found that 72 accounting majors and 52 economics majors had job offers. Assume pooled estimate of the population proportion and a level of significance...
answer neatly and correctly please! It seems these days that college graduates who are employed full-time...
 answer neatly and correctly
please!
It seems these days that college graduates who are employed full-time work more than 40-hour weeks. Data are available that can help us decide if this is true. A survey was recently sent to a group of adults selected at random. There were 9 respondents who were college graduates employed full-time. The mean number of hours worked per week by these 9 respondents was 43 hours, with a standard deviation of 9 hours. . Can...
answer neatly and correctly
please!
It seems these days that college graduates who are employed full-time work more than 40-hour weeks. Data are available that can help us decide if this is true. A survey was recently sent to a group of adults selected at random. There were 9 respondents who were college graduates employed full-time. The mean number of hours worked per week by these 9 respondents was 43 hours, with a standard deviation of 9 hours. . Can...
Well help Two professors at a local college developed a new teaching curriculum designed to increase...
 Well help Two professors at a local college developed a new teaching curriculum designed to increase students' grades in math classes. In a typical developmental math course 56% of the students complete the course with a letter grade of A, B, or C. In the experimental course, of the 17 students enrolled, 13 completed the course with a letter grade of A, B, or C. Is the experimental course effective at the u=0.01 level of significance? Complete parts (a) through...
A recent article claimed that the mean wedding cost in the US is $28,400. A random...
A recent article claimed that the mean wedding cost in the US is $28,400. A random sample of 44 weddings from this year was taken from the western New York region. Test, at the 5% significance level, if the mean cost of a wedding in Western New York is different than the national average. The costs of those weddings are in the Excel spreadsheet under the Files link, in the tab named Wedding costs. What is the value of the...
A clinical trial was conducted using a new method designed to increase the probability of conceiving...
A clinical trial was conducted using a new method designed to increase the probability of conceiving a boy. As of this writing, 304 babies were born to parents using the new method, and 245 of them were boys. Use a 0.01 significance level to test the claim that the new method is effective in increasing the likelihood that a baby will be a boy. Identify the null hypothesis, alternative hypothesis, test statistic, P-value, conclusion about the null hypothesis, and final...
 We're interested in the amount of time spent at work by college graduates employed full-time. The standard amount of time spent at work by full-time employees is 40 hours per week. We suspect that the mean number of hours worked per week by college graduates is less than 40 hours and wish to do a statistical test. We select a random sample of 100 college graduates employed full-time and compute the mean number of hours worked per week by the...
 answer neatly and correctly
please!
It seems these days that college graduates who are employed full-time work more than 40-hour weeks. Data are available that can help us decide if this is true. A survey was recently sent to a group of adults selected at random. There were 9 respondents who were college graduates employed full-time. The mean number of hours worked per week by these 9 respondents was 43 hours, with a standard deviation of 9 hours. . Can...
answer neatly and correctly
please!
It seems these days that college graduates who are employed full-time work more than 40-hour weeks. Data are available that can help us decide if this is true. A survey was recently sent to a group of adults selected at random. There were 9 respondents who were college graduates employed full-time. The mean number of hours worked per week by these 9 respondents was 43 hours, with a standard deviation of 9 hours. . Can...
 Well help Two professors at a local college developed a new teaching curriculum designed to increase students' grades in math classes. In a typical developmental math course 56% of the students complete the course with a letter grade of A, B, or C. In the experimental course, of the 17 students enrolled, 13 completed the course with a letter grade of A, B, or C. Is the experimental course effective at the u=0.01 level of significance? Complete parts (a) through...
Most questions answered within 3 hours.
-
Ang Electronics, Inc., has developed a new HD DVD. If the HD DVD
is successful, the...
asked 23 minutes ago -
which of these substances cannot behave as a lewis base in an aq
solution
a- Co...
asked 29 minutes ago -
Below are some of Toyota’s (an automotive manufacturer) costs to
manufacture a car: I. Depreciation of...
asked 29 minutes ago -
A random sample of 40 cups of coffee from a vending machine had
a sample mean...
asked 49 minutes ago -
The mercury in a fish sample is determined to be 1.80, 1.58 and
1.64 ppm. Calculate...
asked 41 minutes ago -
Suppose a photon is equally likely to be found anywhere in an
interval of 28.5 cm...
asked 51 minutes ago -
Suppose the following is a divide-and-conquer algorithm for some
problem.
"Make the input of size n...
asked 1 hour ago -
Calculate the pH of the resulting solution if 15.0 mL of 0.150 M
HCl(aq) is added...
asked 1 hour ago -
How many moles of sulphur hexaflouride are present in 3.64 x 10^21
molecules of this compound?
asked 1 hour ago -
155 grams of ice at -10.0 degrees celsius is added to 1.17 kg of
water at...
asked 1 hour ago -
How did the Fed encourage business confidence after the
September 11 terrorist attacks? by lowering corporate...
asked 1 hour ago -
Question 201 pts
Which of the following best describes the consumption of a
non-rival good?
Group...
asked 1 hour ago