


Homework Answers


Add Answer to:
Can
I get the solution for question 18?
This is all . There is no more...
Would someone explain to me how to get the answers, please. I need the graphs plotted,...
 Would someone explain to me how to get the
answers, please. I need the
graphs plotted, the blue box answer, and the fill in the blanks
answered. Below are the options.
Options for the first graph it says: From the preceding data,
you know that the level of saving in the economy was ($140
billion, $20 billion, $0 billion, $100 billion) and the
marginal propensity to save in the economy is (0.6, 0.8,
0.1, 0.2)
Options for the second graph...
Would someone explain to me how to get the
answers, please. I need the
graphs plotted, the blue box answer, and the fill in the blanks
answered. Below are the options.
Options for the first graph it says: From the preceding data,
you know that the level of saving in the economy was ($140
billion, $20 billion, $0 billion, $100 billion) and the
marginal propensity to save in the economy is (0.6, 0.8,
0.1, 0.2)
Options for the second graph...
Best AE CIG +I+G • Y Y Y Y Ys 16. The incone level at which...
 Best AE CIG +I+G • Y Y Y Y Ys 16. The incone level at which there would definitely be over-production would be: A. Y B. Y c. Y, D. Y 17. the income level at which the amount of aggregate demand would equal the amount of aggregate supply would be: AYI B. Y, D. Y c. Y 18. From the graph it may be determined that: A. the marginal propensity to invest is positive. B. the marginal propensity to...
For the data given below, answer parts (a) through (f). х y -21 101 - 18...
 For the data given below, answer parts (a) through (f). х y -21 101 - 18 121 - 16 119 - 15 131 - 11 141 (a) Draw a scatter plot. Choose the correct graph below. ОА. Q 150- OB O c. OD @ Q 150- 150- 150- -30 -30 0 -30 (b) Find the equation of the line containing the first and the last data points. (Type an equation. Type your answer in slope-intercept form. Use integers or fractions...
Question 1: (August 2014/2015) Based on the data for 1995-15Q to 2013-4thQ (n=76), an economist obtained...
 Question 1: (August 2014/2015) Based on the data for 1995-15Q to 2013-4thQ (n=76), an economist obtained the following regression model to explain the personal consumption expenditure (PCE) in country XYZ. R2 = 0.9996 T, =-10.96 +0.93X 2: -2.09X3 t= (-3.33) (249.06) (-3.09) where Y = the PCE (RM in billions) A2 = the disposable income (RM in billions) 43 = the prime rate charged by banks (%) Determine the marginal propensity to consume (MPC). (b) Is the Marginal Propensity to...
Chapter 13 Homework 00 Data on before tax income taxes paid, and consumption spending for the...
 Chapter 13 Homework 00 Data on before tax income taxes paid, and consumption spending for the Simpson family in various years are given below. Before-tax inco ($) 25,800 27.000 28,69 Taxes paid (s) 3,00 Consumption spending ($) 20,000 21,350 22.07 23.600 4. Ono a. Graph the Simpsons' consumption function, then find their household's marginal propensity to consume and the intercept of the consumption function Instructions: On the graph below, use the line tool provided. Click and drag your mouse to...
graphing calculator 2. Use a graphing calculator or a spreadsheet to a create scatter plot, line...
 graphing calculator
2. Use a graphing calculator or a spreadsheet to a create scatter plot, line of best fit, and determine the correlation coefficient for the following data that relates a person's age and his/her height. Classify the type of correlation that is shown AGE 20 40 65 80 92 108 a from each of the following. Label the axes to indicate the independent and dependent variable 3. Sketch a scatter plot that could represent dat a. peopie's ages (starting...
graphing calculator
2. Use a graphing calculator or a spreadsheet to a create scatter plot, line of best fit, and determine the correlation coefficient for the following data that relates a person's age and his/her height. Classify the type of correlation that is shown AGE 20 40 65 80 92 108 a from each of the following. Label the axes to indicate the independent and dependent variable 3. Sketch a scatter plot that could represent dat a. peopie's ages (starting...
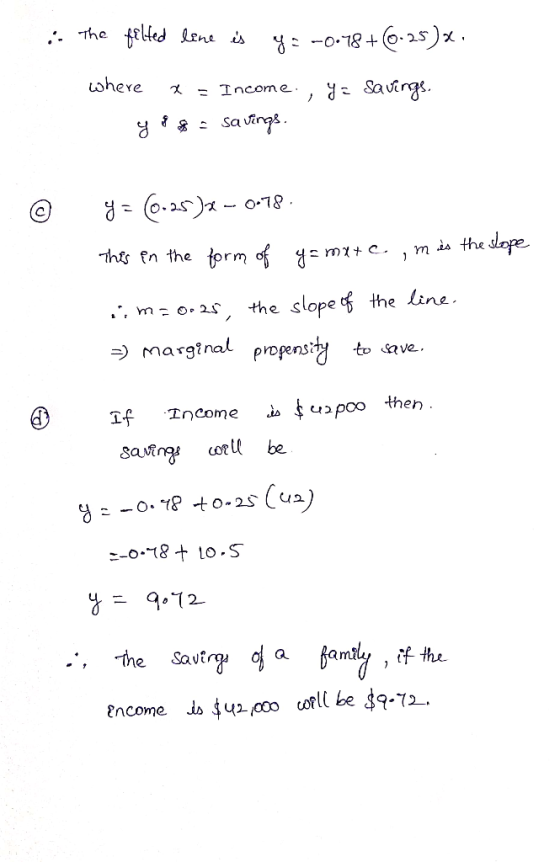
Consider the following table showing aggregate consumption expenditures and disposable income. All values are expressed in...
 Consider the following table showing aggregate consumption expenditures and disposable income. All values are expressed in billions of constant dollars. a. Compute desired saving at each level of disposable income. (Round your responses to the nearest whole number.) 50- Disposable Income (Y) Desired Consumption (C) NUL Savings 100 200 300 400 5 0 600 700 800 100 180 Savings (5) -50/ 260 100 200 300 400 500 600 340 420 500 580 Click the graph, choose a tool in the...
. The following are advertised sale prices of color televisions at Anderson's Size (inches) Sale Price...
 . The following are advertised sale prices of color televisions at Anderson's Size (inches) Sale Price ($) 147 9 197 20 297 27 31 447 35 40 2177 60 2497 Table 12.3:3 a. Decide which variable should be the independent variable and which should be the dependent variable. b. Draw a scatter plot of the data. c. Does it appear from inspection that there is a relationship between the variables? Why or why not? d. Calculate the least-squares line. Put...
QUESTION 5 C DI C 50 $65 0 10 110 12520 20 20 18 160 18540...
 QUESTION 5 C DI C 50 $65 0 10 110 12520 20 20 18 160 18540 38 30 25 240 245 056 320 30580 74 s039400 365 100 92 Refer to the given consumption schedules DI signifies disposable income and C O A is highest in economy (3) are in bilfions of doilars. The marginal propensity to consume OB is highest in economy Q) 0 c is highest in economy (1) OD cannot be calculated from the data given
 Would someone explain to me how to get the
answers, please. I need the
graphs plotted, the blue box answer, and the fill in the blanks
answered. Below are the options.
Options for the first graph it says: From the preceding data,
you know that the level of saving in the economy was ($140
billion, $20 billion, $0 billion, $100 billion) and the
marginal propensity to save in the economy is (0.6, 0.8,
0.1, 0.2)
Options for the second graph...
Would someone explain to me how to get the
answers, please. I need the
graphs plotted, the blue box answer, and the fill in the blanks
answered. Below are the options.
Options for the first graph it says: From the preceding data,
you know that the level of saving in the economy was ($140
billion, $20 billion, $0 billion, $100 billion) and the
marginal propensity to save in the economy is (0.6, 0.8,
0.1, 0.2)
Options for the second graph...
 Best AE CIG +I+G • Y Y Y Y Ys 16. The incone level at which there would definitely be over-production would be: A. Y B. Y c. Y, D. Y 17. the income level at which the amount of aggregate demand would equal the amount of aggregate supply would be: AYI B. Y, D. Y c. Y 18. From the graph it may be determined that: A. the marginal propensity to invest is positive. B. the marginal propensity to...
 For the data given below, answer parts (a) through (f). х y -21 101 - 18 121 - 16 119 - 15 131 - 11 141 (a) Draw a scatter plot. Choose the correct graph below. ОА. Q 150- OB O c. OD @ Q 150- 150- 150- -30 -30 0 -30 (b) Find the equation of the line containing the first and the last data points. (Type an equation. Type your answer in slope-intercept form. Use integers or fractions...
 Question 1: (August 2014/2015) Based on the data for 1995-15Q to 2013-4thQ (n=76), an economist obtained the following regression model to explain the personal consumption expenditure (PCE) in country XYZ. R2 = 0.9996 T, =-10.96 +0.93X 2: -2.09X3 t= (-3.33) (249.06) (-3.09) where Y = the PCE (RM in billions) A2 = the disposable income (RM in billions) 43 = the prime rate charged by banks (%) Determine the marginal propensity to consume (MPC). (b) Is the Marginal Propensity to...
 Chapter 13 Homework 00 Data on before tax income taxes paid, and consumption spending for the Simpson family in various years are given below. Before-tax inco ($) 25,800 27.000 28,69 Taxes paid (s) 3,00 Consumption spending ($) 20,000 21,350 22.07 23.600 4. Ono a. Graph the Simpsons' consumption function, then find their household's marginal propensity to consume and the intercept of the consumption function Instructions: On the graph below, use the line tool provided. Click and drag your mouse to...
 graphing calculator
2. Use a graphing calculator or a spreadsheet to a create scatter plot, line of best fit, and determine the correlation coefficient for the following data that relates a person's age and his/her height. Classify the type of correlation that is shown AGE 20 40 65 80 92 108 a from each of the following. Label the axes to indicate the independent and dependent variable 3. Sketch a scatter plot that could represent dat a. peopie's ages (starting...
graphing calculator
2. Use a graphing calculator or a spreadsheet to a create scatter plot, line of best fit, and determine the correlation coefficient for the following data that relates a person's age and his/her height. Classify the type of correlation that is shown AGE 20 40 65 80 92 108 a from each of the following. Label the axes to indicate the independent and dependent variable 3. Sketch a scatter plot that could represent dat a. peopie's ages (starting...
 Consider the following table showing aggregate consumption expenditures and disposable income. All values are expressed in billions of constant dollars. a. Compute desired saving at each level of disposable income. (Round your responses to the nearest whole number.) 50- Disposable Income (Y) Desired Consumption (C) NUL Savings 100 200 300 400 5 0 600 700 800 100 180 Savings (5) -50/ 260 100 200 300 400 500 600 340 420 500 580 Click the graph, choose a tool in the...
 . The following are advertised sale prices of color televisions at Anderson's Size (inches) Sale Price ($) 147 9 197 20 297 27 31 447 35 40 2177 60 2497 Table 12.3:3 a. Decide which variable should be the independent variable and which should be the dependent variable. b. Draw a scatter plot of the data. c. Does it appear from inspection that there is a relationship between the variables? Why or why not? d. Calculate the least-squares line. Put...
 QUESTION 5 C DI C 50 $65 0 10 110 12520 20 20 18 160 18540 38 30 25 240 245 056 320 30580 74 s039400 365 100 92 Refer to the given consumption schedules DI signifies disposable income and C O A is highest in economy (3) are in bilfions of doilars. The marginal propensity to consume OB is highest in economy Q) 0 c is highest in economy (1) OD cannot be calculated from the data given
Most questions answered within 3 hours.
-
The blues made its way into many kinds of music. Eric Clapton,
The Beatles, and Elvis...
asked 22 minutes ago -
If you’re standing at the bottom of a hill and asked to evaluate
it while being...
asked 1 hour ago -
1. Which region has taken the lead in the world of
e-waste handling?
a) European Union...
asked 1 hour ago -
A 8.15- g bullet from a 9-mm pistol has a velocity of 366.0 m/s.
It strikes...
asked 2 hours ago -
The outstanding bonds of Alpha Extracts have a yield to maturity
of 7.4 percent and a...
asked 2 hours ago -
The Problem: The Case of the Harmonizing Vacations
Your CEO is exploring partnering with a European...
asked 4 hours ago -
A chemical equation is balanced by adding coefficients in front
of some formulas so that the...
asked 4 hours ago -
From the literature (reference your sources): What are the
lattice parameters of calcite and aragonite? Why...
asked 4 hours ago -
Your system is rejecting the question am asking which is
preceded by a case study. It...
asked 4 hours ago -
3. On January 2, 2000, Larry creates a trust with himself as
trustee. Larry as trustee...
asked 4 hours ago -
A member of the volleyball team spikes the ball. During this
process, she changes the velocity...
asked 4 hours ago -
Are adult gamers less likely to use a gaming console (Xbox,
PlayStation, Wii, etc...) than teen...
asked 5 hours ago