
Homework Answers
Add Answer to:
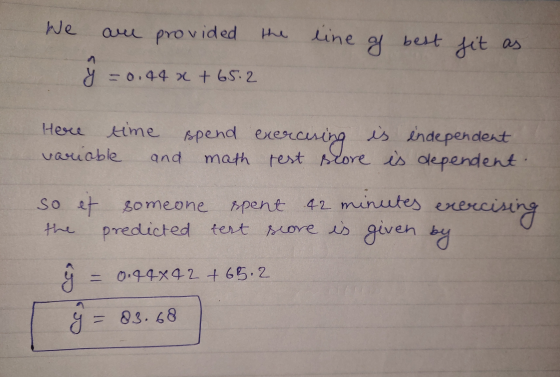
Make predictions using a line of best fit Question The table shows data collected on the...
Data is collected on the relationship between the average number of minutes spent exercising per day...
Data is collected on the relationship between the average number of minutes spent exercising per day and math test scores. The data is shown in the table and the line of best fit for the data is yˆ=0.44x+60.7. Minutes 25303540 Test Score 72747579 (a) According to the line of best fit, the predicted test score for someone who spent 31 minutes exercising is 74.34. PLEASE HELP WITH PART B (b) Is it reasonable to use this line of best fit...
Data is collected on the relationship between time spent playing video games and time spent with...
Data is collected on the relationship between time spent playing video games and time spent with family. The data is shown in the table and the line of best fit for the data is y^=−0.27x+57.5. Assume the line of best fit is significant and there is a strong linear relationship between the variables. Video Games (Minutes) 306090120 Time with Family (Minutes) 50403525 According to the line of best fit, the predicted number of minutes spent with family for someone who...
The “least square regression model” is based on the “best fit” line to the data. This...
The “least square regression model” is based on the “best fit” line to the data. This will determine a line equation for LINEAR data that will minimize “residual” values (difference between actual and “predicted” ) True or False Correlation tells us if there is a relationship between two numeric variables and how strong that relationship is: True or False
The table shows data collected on the relationship between the average daily temperature and coffee sales (in hundreds of dollars) at a coffee shop. The line of best fit for the data is -0...
 The table shows data collected on the relationship between the average daily temperature and coffee sales (in hundreds of dollars) at a coffee shop. The line of best fit for the data is -0.68z +85.1. Assume the line of best fit is significant and there is a strong linear relationship between the variables. Temperature (Degrees) Coffee Sales (in hundreds of dollars) 30 40 50 60 65 58 50 45 According to the line of best fit, what would be the...
Question 312 marks An study was conducted using data from pedometers of 68 randomly selected part...
 Question 312 marks An study was conducted using data from pedometers of 68 randomly selected participants. The researchers wanted to know if the number of steps taken by a participant (Steps) could be predicted using the time they spent walking (Minutes). The data are available on MyUni in the file Steps.csv. 2 (a) Produce a scatterplot of Steps vs Minutes and describe any relationship between these two variables. (b) Perform a linear regression analysis on this data in MATLAB and...
e of Contents Knewton Coursework y Unit 9:Linear Correlation and RegressionUnit 9.4 Uses of Linear Regression...
 e of Contents Knewton Coursework y Unit 9:Linear Correlation and RegressionUnit 9.4 Uses of Linear Regression nit 9.4 Uses of Linear Regression yuesuon The table shows data collected on the relationship between the average daily temperature and time spent watching television The line of best fit for the data is y -0.66x +88.5 Temperature (Degrees) Minutes Watching Television 35 45 58 s52 46 65 ( According to the line of best fit, the predicted number of minutes spent watching television...
Question 3 < > The time spent studying for a test and the test scores are...
 Question 3 < > The time spent studying for a test and the test scores are graphed below along with the best-fit line. e = 1.04 t + 38.4 100 90 Exam score, e Ipoints) 80 70 60 10 20 50+ 30 40 50 60 Study Time, t (minutes) Q What score does the equation e = 1.04t + 38.4, predict for a student who studies for 30 minutes. Round your answer to the nearest whole number score. Select an...
4,5 and 6 please 4) Analysis of data from a statistical study showsa lincar relationship in...
 4,5 and 6 please
4) Analysis of data from a statistical study showsa lincar relationship in the data with a correlation coeflicient of -0.524. Which statement best summarines this resul There is a strong positive corelation between the variables There is a strong negative correlation between he variables There is a moderate positive cornelation beween the variables. There is a moderate negative corelation between the variables 4 5) The scatter plot below represents the relationship between the number of peanuts...
4,5 and 6 please
4) Analysis of data from a statistical study showsa lincar relationship in the data with a correlation coeflicient of -0.524. Which statement best summarines this resul There is a strong positive corelation between the variables There is a strong negative correlation between he variables There is a moderate positive cornelation beween the variables. There is a moderate negative corelation between the variables 4 5) The scatter plot below represents the relationship between the number of peanuts...
The following data was collected to explore how the average number of hours a student studies...
 The following data was collected to explore how the average number of hours a student studies per night and the student's PA affect their ACT score. The dependent variable is the ACT score, the first independent variable (ri) is the number of hours spent studying and the second independent variable (x2) is the student's GPA Effects on ACT Scores Study Hours GPA ACT Score 24 21 19 17 Copy Data Step 1 of 2: Find the p-value for the regression...
Name: Instructor Date: Section 6. The regression line equation for a set of data is given...
 Name: Instructor Date: Section 6. The regression line equation for a set of data is given by y-23x+. -10. The value of for this same data set is 10.1. Use α .05 a. If the lincar correlation coefficient for this data is -521, what is the best y -value for x 57 b. If the linear correlation coefficient for this data is r 972, what is the best predicted y-value for x=5? size n 15 with a 01 7. What...
 The table shows data collected on the relationship between the average daily temperature and coffee sales (in hundreds of dollars) at a coffee shop. The line of best fit for the data is -0.68z +85.1. Assume the line of best fit is significant and there is a strong linear relationship between the variables. Temperature (Degrees) Coffee Sales (in hundreds of dollars) 30 40 50 60 65 58 50 45 According to the line of best fit, what would be the...
 Question 312 marks An study was conducted using data from pedometers of 68 randomly selected participants. The researchers wanted to know if the number of steps taken by a participant (Steps) could be predicted using the time they spent walking (Minutes). The data are available on MyUni in the file Steps.csv. 2 (a) Produce a scatterplot of Steps vs Minutes and describe any relationship between these two variables. (b) Perform a linear regression analysis on this data in MATLAB and...
 e of Contents Knewton Coursework y Unit 9:Linear Correlation and RegressionUnit 9.4 Uses of Linear Regression nit 9.4 Uses of Linear Regression yuesuon The table shows data collected on the relationship between the average daily temperature and time spent watching television The line of best fit for the data is y -0.66x +88.5 Temperature (Degrees) Minutes Watching Television 35 45 58 s52 46 65 ( According to the line of best fit, the predicted number of minutes spent watching television...
 Question 3 < > The time spent studying for a test and the test scores are graphed below along with the best-fit line. e = 1.04 t + 38.4 100 90 Exam score, e Ipoints) 80 70 60 10 20 50+ 30 40 50 60 Study Time, t (minutes) Q What score does the equation e = 1.04t + 38.4, predict for a student who studies for 30 minutes. Round your answer to the nearest whole number score. Select an...
 4,5 and 6 please
4) Analysis of data from a statistical study showsa lincar relationship in the data with a correlation coeflicient of -0.524. Which statement best summarines this resul There is a strong positive corelation between the variables There is a strong negative correlation between he variables There is a moderate positive cornelation beween the variables. There is a moderate negative corelation between the variables 4 5) The scatter plot below represents the relationship between the number of peanuts...
4,5 and 6 please
4) Analysis of data from a statistical study showsa lincar relationship in the data with a correlation coeflicient of -0.524. Which statement best summarines this resul There is a strong positive corelation between the variables There is a strong negative correlation between he variables There is a moderate positive cornelation beween the variables. There is a moderate negative corelation between the variables 4 5) The scatter plot below represents the relationship between the number of peanuts...
 The following data was collected to explore how the average number of hours a student studies per night and the student's PA affect their ACT score. The dependent variable is the ACT score, the first independent variable (ri) is the number of hours spent studying and the second independent variable (x2) is the student's GPA Effects on ACT Scores Study Hours GPA ACT Score 24 21 19 17 Copy Data Step 1 of 2: Find the p-value for the regression...
 Name: Instructor Date: Section 6. The regression line equation for a set of data is given by y-23x+. -10. The value of for this same data set is 10.1. Use α .05 a. If the lincar correlation coefficient for this data is -521, what is the best y -value for x 57 b. If the linear correlation coefficient for this data is r 972, what is the best predicted y-value for x=5? size n 15 with a 01 7. What...
Most questions answered within 3 hours.
-
An empty test tube weighs 15.923 grams. Then,
MgCl2•6H2O is added into the test tube. After...
asked 43 minutes ago -
Please answer true or false. Words
cannot be changed or added in to make it true...
asked 41 minutes ago -
(a) A piston at 6.1 atm contains a gas that occupies a volume of
3.5 L....
asked 42 minutes ago -
Assume memory access is 10 units of time and disk access is
10000 units of time....
asked 1 hour ago -
1. Are all good samples random?
2. Magazines often report surveys giving statistics such as “63%...
asked 1 hour ago -
Under all the various types of market structures, firms
must eventually earn some economic profits for...
asked 1 hour ago -
Consider the following fitness regime for a single locus trait
with two co-dominant alleles: w11 =...
asked 1 hour ago -
A large cable company reports the following.
80% of its customers subscribe to its cable TV...
asked 1 hour ago -
Please answer the question in brief.
Discuss the role of ERP in organizations. Are ERP tools...
asked 1 hour ago -
Discuss the pros and cons of collaborative software such
as SameTime. Does it increase productivity? What...
asked 1 hour ago -
Buying your in-laws a gift because it’s expected is
due to the ____________ motive of gift-giving....
asked 1 hour ago -
Calculate the expected value, the variance, and the standard
deviation of the given random variable X....
asked 2 hours ago