figure chocolate
what is the equilibrium price per pound in the diagram?
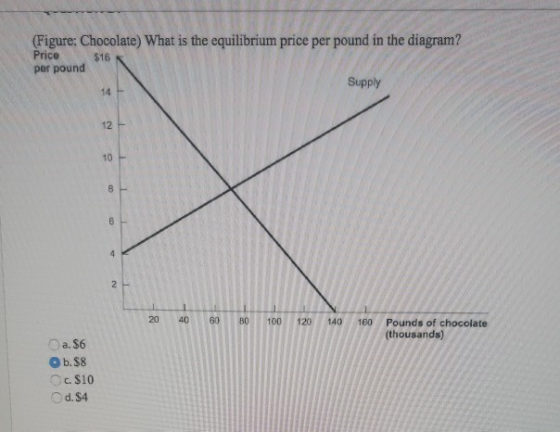
Homework Answers
b. $8 - is correct
Equilibrium reaches at the intersection of demand and supply curve
that is at price = 8
Add Answer to:
figure chocolate
what is the equilibrium price per pound in the diagram?
(Figure: Chocolate) What is...
Refer to the figure below. What is total consumer surplus at the market equilibrium? Select one:...
 Refer to the figure below. What is total consumer surplus at the
market equilibrium?
Select one:
a. $6 per day
b. $80 per day
c. $160 per day
d. $240 per day
Supply Price ($/pound) Demand 0 10 20 30 40 50 60 70 80 Quantity (pounds of cheese/day)
Refer to the figure below. What is total consumer surplus at the
market equilibrium?
Select one:
a. $6 per day
b. $80 per day
c. $160 per day
d. $240 per day
Supply Price ($/pound) Demand 0 10 20 30 40 50 60 70 80 Quantity (pounds of cheese/day)
Figure 10 1 Price 200 180 160 + 140 + 120 100+ 80 60 40 20...
 Figure 10 1 Price 200 180 160 + 140 + 120 100+ 80 60 40 20 20 40 60 80 100 120 140 160 Duantity Refer to Figure 10. If the equilibrium price is $60, what is the producer surplus? a. $600 b. $1,200 C. $2,400 d. $4,800 Refer to Figure 10. If the equilibrium price rises from $60 to $120, what is the additional producer surplus to initial producers in the market? a. $1,200 b. $2,400 c. $3,600 d....
57. The following figure shows the market supply and demand of a good whose production entails...
57. The following figure shows the market supply and demand of a good whose production entails a $2 negative externality per unit. Refer to the figure above. A total of ________ units of this good will be traded in this market, at the price of ________. a. 20; $2 b. 60; $8 c. 40; $4 d. 80; $6 58. The following figure shows the market supply and demand of a good whose production entails a $2 negative externality per unit....
* Question Completion Status: 1 Price 110 + 8 Supply 8 8 +- 8 Demand 8...
 * Question Completion Status: 1 Price 110 + 8 Supply 8 8 +- 8 Demand 8 40+ S89 + + - 10 20 30 40 50 60 70 80 90 100 110 120 130 140 150 160 170 Quantity Refer to Figure 7-22. At the equilibrium price, total surplus is a. $3,500 b. $7,000. c. $2,500. d. $1,000 Supply HT + + + + + + + + + Demand + + + + 2 + 3 + 4 +...
EQUILIBRIUM CALCULATOR: MARKET FOR HEATING OIL PRICE (Dollars per barrel] 80 Price of Heating Oil 30...
 EQUILIBRIUM CALCULATOR: MARKET FOR HEATING OIL PRICE (Dollars per barrel] 80 Price of Heating Oil 30 Dollars per barrel) Quantity Demanded Thousands of barrels/day] Shortage 70 100 Quantity Supplied 60 60 Thousands of barrels/day) 50 40 Surplus Thousands of barrels/day) Thousands of barrels/day) 40 DEMAND SHIFTERS SUPPLY SHIFTERS 30 Price of Natural Gas [Dollars per 1,000 cubic ft.] Cost of Crude Oil Per barrel of heating oil] 10 25 20 Price of an Oil Furnace [Dollars per furnace] Cost of...
solution please Q(5): Price Quantity Quantity (dollars per supplied demanded pound) (pounds) (pounds) 3 1 7...
 solution please
Q(5): Price Quantity Quantity (dollars per supplied demanded pound) (pounds) (pounds) 3 1 7 4 2 5 5 4 4 6 5 2 7 6 1 The above table shows the demand schedule and supply schedule for chocolate chip cookies. Use the Demand function and Supply function to find the equilibrium quantity and equilibrium price for chocolate chip cookies? Equilibrium quantity= 4 Equilibrium Price= 5 Q(6): Personal computers are becoming less expensive as new technology reduces the cost...
solution please
Q(5): Price Quantity Quantity (dollars per supplied demanded pound) (pounds) (pounds) 3 1 7 4 2 5 5 4 4 6 5 2 7 6 1 The above table shows the demand schedule and supply schedule for chocolate chip cookies. Use the Demand function and Supply function to find the equilibrium quantity and equilibrium price for chocolate chip cookies? Equilibrium quantity= 4 Equilibrium Price= 5 Q(6): Personal computers are becoming less expensive as new technology reduces the cost...
Please give the formula for these two questions 1 Price Supply Demand 1 2 3 4...
 Please give the formula for
these two questions
1 Price Supply Demand 1 2 3 4 5 6 7 8 9 10 11 12 13 14 15 16 17 18 19 20 21 22 23 24 25 Quantity At the equilibrium price, total surplus is 11. + Refer to Figure 7-15. a. $150. b. $200. c. $250. d. $300. Figure 7-18 1 Price Supply Demand 10 20 30 40 50 60 70 80 90 100 110 120 130 140 150...
Please give the formula for
these two questions
1 Price Supply Demand 1 2 3 4 5 6 7 8 9 10 11 12 13 14 15 16 17 18 19 20 21 22 23 24 25 Quantity At the equilibrium price, total surplus is 11. + Refer to Figure 7-15. a. $150. b. $200. c. $250. d. $300. Figure 7-18 1 Price Supply Demand 10 20 30 40 50 60 70 80 90 100 110 120 130 140 150...
(Figure: Price and Quantity 2) At a cost of $20 per unit in the diagram, the...
 (Figure: Price and Quantity 2) At a cost of $20 per unit in the diagram, the value of the unexploited gains from trade is: Price $100 80 60 B m 50 40 с 20 10 20 30 40 50 60 70 80 90 100 Quantity A. $600. B. $200. C. $500 D. $900. 1 po A market can be described by the equations Qd = 50 - 3 P and Qs =2 P. What are the equilibrium price and quantity...
Suppose that the turkey industry is in long-run equilibrium at a price of $5 per pound...
 Suppose that the turkey industry is in long-run equilibrium at a price of $5 per pound of turkey and a quantity of 250 million pounds per year. Suppose that the Centers for Disease Control (CDC) announces that a chemical found in turkey helps prevent many viral infections from spreading. The CDC's announcement will cause consumers to demand turkey at every price. In the short run, firms will respond by less more Shift the demand curve, the supply curve, or both...
Suppose that the shrimp industry is in long-run equilibrium at a price of $5 per pound...
 Suppose that the shrimp industry is in long-run equilibrium at a price of $5 per pound of shrimp and a quantity of 300 million pounds per year. Suppose that WebMD claims that the bacteria found in shrimp will decrease your expected lifespan by 2 years. WebMD's claim will cause consumers to demand shrimp at every price. In the short run, firms will respond by producing more shrimp and earning positive profit Sh o illustrate these short-run effects of WebMD's claim....
 Refer to the figure below. What is total consumer surplus at the
market equilibrium?
Select one:
a. $6 per day
b. $80 per day
c. $160 per day
d. $240 per day
Supply Price ($/pound) Demand 0 10 20 30 40 50 60 70 80 Quantity (pounds of cheese/day)
Refer to the figure below. What is total consumer surplus at the
market equilibrium?
Select one:
a. $6 per day
b. $80 per day
c. $160 per day
d. $240 per day
Supply Price ($/pound) Demand 0 10 20 30 40 50 60 70 80 Quantity (pounds of cheese/day)
 Figure 10 1 Price 200 180 160 + 140 + 120 100+ 80 60 40 20 20 40 60 80 100 120 140 160 Duantity Refer to Figure 10. If the equilibrium price is $60, what is the producer surplus? a. $600 b. $1,200 C. $2,400 d. $4,800 Refer to Figure 10. If the equilibrium price rises from $60 to $120, what is the additional producer surplus to initial producers in the market? a. $1,200 b. $2,400 c. $3,600 d....
 * Question Completion Status: 1 Price 110 + 8 Supply 8 8 +- 8 Demand 8 40+ S89 + + - 10 20 30 40 50 60 70 80 90 100 110 120 130 140 150 160 170 Quantity Refer to Figure 7-22. At the equilibrium price, total surplus is a. $3,500 b. $7,000. c. $2,500. d. $1,000 Supply HT + + + + + + + + + Demand + + + + 2 + 3 + 4 +...
 EQUILIBRIUM CALCULATOR: MARKET FOR HEATING OIL PRICE (Dollars per barrel] 80 Price of Heating Oil 30 Dollars per barrel) Quantity Demanded Thousands of barrels/day] Shortage 70 100 Quantity Supplied 60 60 Thousands of barrels/day) 50 40 Surplus Thousands of barrels/day) Thousands of barrels/day) 40 DEMAND SHIFTERS SUPPLY SHIFTERS 30 Price of Natural Gas [Dollars per 1,000 cubic ft.] Cost of Crude Oil Per barrel of heating oil] 10 25 20 Price of an Oil Furnace [Dollars per furnace] Cost of...
 solution please
Q(5): Price Quantity Quantity (dollars per supplied demanded pound) (pounds) (pounds) 3 1 7 4 2 5 5 4 4 6 5 2 7 6 1 The above table shows the demand schedule and supply schedule for chocolate chip cookies. Use the Demand function and Supply function to find the equilibrium quantity and equilibrium price for chocolate chip cookies? Equilibrium quantity= 4 Equilibrium Price= 5 Q(6): Personal computers are becoming less expensive as new technology reduces the cost...
solution please
Q(5): Price Quantity Quantity (dollars per supplied demanded pound) (pounds) (pounds) 3 1 7 4 2 5 5 4 4 6 5 2 7 6 1 The above table shows the demand schedule and supply schedule for chocolate chip cookies. Use the Demand function and Supply function to find the equilibrium quantity and equilibrium price for chocolate chip cookies? Equilibrium quantity= 4 Equilibrium Price= 5 Q(6): Personal computers are becoming less expensive as new technology reduces the cost...
 Please give the formula for
these two questions
1 Price Supply Demand 1 2 3 4 5 6 7 8 9 10 11 12 13 14 15 16 17 18 19 20 21 22 23 24 25 Quantity At the equilibrium price, total surplus is 11. + Refer to Figure 7-15. a. $150. b. $200. c. $250. d. $300. Figure 7-18 1 Price Supply Demand 10 20 30 40 50 60 70 80 90 100 110 120 130 140 150...
Please give the formula for
these two questions
1 Price Supply Demand 1 2 3 4 5 6 7 8 9 10 11 12 13 14 15 16 17 18 19 20 21 22 23 24 25 Quantity At the equilibrium price, total surplus is 11. + Refer to Figure 7-15. a. $150. b. $200. c. $250. d. $300. Figure 7-18 1 Price Supply Demand 10 20 30 40 50 60 70 80 90 100 110 120 130 140 150...
 (Figure: Price and Quantity 2) At a cost of $20 per unit in the diagram, the value of the unexploited gains from trade is: Price $100 80 60 B m 50 40 с 20 10 20 30 40 50 60 70 80 90 100 Quantity A. $600. B. $200. C. $500 D. $900. 1 po A market can be described by the equations Qd = 50 - 3 P and Qs =2 P. What are the equilibrium price and quantity...
 Suppose that the turkey industry is in long-run equilibrium at a price of $5 per pound of turkey and a quantity of 250 million pounds per year. Suppose that the Centers for Disease Control (CDC) announces that a chemical found in turkey helps prevent many viral infections from spreading. The CDC's announcement will cause consumers to demand turkey at every price. In the short run, firms will respond by less more Shift the demand curve, the supply curve, or both...
 Suppose that the shrimp industry is in long-run equilibrium at a price of $5 per pound of shrimp and a quantity of 300 million pounds per year. Suppose that WebMD claims that the bacteria found in shrimp will decrease your expected lifespan by 2 years. WebMD's claim will cause consumers to demand shrimp at every price. In the short run, firms will respond by producing more shrimp and earning positive profit Sh o illustrate these short-run effects of WebMD's claim....
Most questions answered within 3 hours.
-
This java code won't run and I can't figure out the problem with
it. Please help...
asked 27 minutes ago -
Trace the following recursive methods:
a) isPal with the string “abccda”
b) isAnBn with the string...
asked 1 hour ago -
1. Which of the following is false about photosynthesis?
A. ATP is the molecule used to...
asked 2 hours ago -
A simple random sample of size n=64 is obtained from a
population with a mean of...
asked 3 hours ago -
(2 dimensions, 1 object, 2 accelerations)
1) A projectile is thrown with a wind. The wind...
asked 4 hours ago -
Brian makes $34,100 per year. How much can Brian expect to
contribute to FICA taxes in...
asked 4 hours ago -
To buy a new house you must borrow $155,000. To do this you take
out a...
asked 5 hours ago -
Spacely Sprockets is evaluating the construction of a new plant
on land the company purchased for...
asked 5 hours ago -
1. Consider a linear regression model of y on K regressors and
an intercept.
(i) Describe...
asked 5 hours ago -
Enter a balanced equation for the reaction between hydrochloric
acid and sodium sulfite.
Express your answer...
asked 6 hours ago -
Give a regular expression describing the language
{x | x ∈ Σ* and x does not...
asked 6 hours ago -
Masses of 1.0 kg, 2.0 kg, and 3.0 kg are each separately subject
to a net...
asked 6 hours ago