Just number 22 please, can't solve it!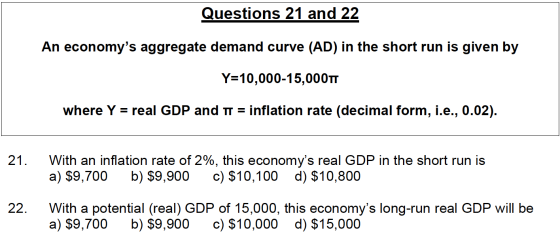
Homework Answers
Answer
Option d
$15000
====
the potential GDP is the long-run equilibrium GDP as the potential
GDP is denoted by the vertical long-run aggregate supply and the
PPF line because it is the full-employment GDP.
Add Answer to:
Just number 22 please, can't solve it!
Questions 21 and 22 An economy's aggregate demand curve...
6.The Aggregate Demand (AD) curve is obtained by combining: (a) The consumption function, planned investment and...
6.The Aggregate Demand (AD) curve is obtained by combining: (a) The consumption function, planned investment and the central bank's policy reaction function. (b) The consumption function and the Taylor rule. (c) The equation for PAE, the central bank's policy reaction and Y = PAE. (d) Y=PAE and the consumption function. (e) The equation for planned investment and the central bank policy reaction function. 7.The AD curve is generally assumed to have a negative slope. However, which of the following would...
The economy's long-run equilibrium is at the point where the aggregate demand curve intersects the long-run...
The economy's long-run equilibrium is at the point where the aggregate demand curve intersects the long-run aggregate supply curve. True False The aggregate supply curve shows the relationship between real GDP and the average price level. True False
In the graph, the initial aggregate supply curve is AS and the initial aggregate demand curve...
 In the graph, the initial aggregate supply curve is AS and the initial aggregate demand curve is ADo Some events that could have changed aggregate demand from AD, to AD are O A. a fall in the exchange rate or Price level 0 AS AS an increase in expected future inflation O B. a decrease in the money wage rate or 105 10 an increase in potential GDP ( 100 C. a decrease in expected future income or a decrease...
An increase in the price level will A) shift the aggregate demand curve to the left.
7) An increase in the price level will A) shift the aggregate demand curve to the left. B) shift the aggregate demand curve to the right. C) move the economy up along the aggregate demand curve. D) move the economy down along the aggregate demand curve. 8) Expansionary monetary policy involves A) reducing money supply and lowering taxes B) increasing money supply to decrease interest rate C) increasing government spending and cutting money supply D) increasing the interest rate and increasing taxes 9) Long-run macroeconomic equilibrium occurs when A) aggregate demand...
The slope of the aggregate demand curve is determined: a/only by the sensitivity of the IS...
The slope of the aggregate demand curve is determined: a/only by the sensitivity of the IS curve, or short-run output, to the real interest rate. b/only by the sensitivity of short-run output to the inflation rate. c/by the sensitivity of short-run output to both inflation and the real interest rate.c/only by the sensitivity of short-run output to the inflation target. d/by the sensitivity of short-run output to the real interest rate and by the central bank sensitivity to inflation. e/by...
()-run equilibrium occurs at the intersection of the aggregate demand curve, AD, and the short-run aggregate...
()-run equilibrium occurs at the intersection of the aggregate demand curve, AD, and the short-run aggregate supply curve, SRAS.() ▼ Long Short -run equilibrium occurs at the intersection of AD and the long-run aggregate supply curve, LRAS. Any unanticipated shifts in aggregate demand or supply are called aggregate demand or aggregate supply() ▼ shocks externalities . When aggregate demand decreases while aggregate supply is stable,() ▼ a recessionary an inflationary gap can occur, defined as the difference between how much...
The graph below depicts an economy where an increase in aggregate demand has caused inflation. The...
 The graph below depicts an economy where an increase in aggregate demand has caused inflation. The economy's current level of real GDP (Y2) is above its long-run equilibrium. This is illustrated by the long-run aggregate supply curve (LRAS) and a price level (P2) above the equilibrium value of Pe Fiscal Policy LRAS AS AD. 1 Real GDP Which of the following is an example of an automatic stabilizer that would help this economy move toward fll employment again? A reduction...
Given a downward-sloping aggregate demand (AD) curve and an upward-sloping short-run aggregate supply curve (SRAS), equilibrium...
Given a downward-sloping aggregate demand (AD) curve and an upward-sloping short-run aggregate supply curve (SRAS), equilibrium occurs where the two intersect. The value on the vertical axis is the equilibrium price level and the value on the horizontal axis is the equilibrium value of real GDP or output. What happens to the economy when AD shifts? It is useful to sketch a graph and show the shift. Suppose, for example, interest rates fall or wealth increases due to a stock...
1. Aggregate supply definitions The short-run aggregate supply curve shows: What happens to output in an...
 1. Aggregate supply definitions The short-run aggregate supply curve shows: What happens to output in an economy when the government spends more money How firms respond to changes in interest rates Changes in output in an economy as the price level changes, holding all other determinants of real GDP constar The relationship between the price level and aggregate expenditure Which of the following are assumed to remain unchanged along a given short-run aggregate supply curve? Check all that The price...
The graph below depicts the aggregate demand, Irrun aggregate supply, and short-run aggregate supply curves for...
 The graph below depicts the aggregate demand, Irrun aggregate supply, and short-run aggregate supply curves for the United States at an initial long-run macroeconomic equilibrium Price level] (P) LRAS SRAS Real GDP Consider a situation in which two things happen simultaneously: there is a deterioration of institutions, and the federal government massively increases spending. Which of the graphs below illustrates the shifts in this model given this situation? Price level Price level (P) (P) URAS LRAS, LRAS SRAS SRAS SRAS...
 In the graph, the initial aggregate supply curve is AS and the initial aggregate demand curve is ADo Some events that could have changed aggregate demand from AD, to AD are O A. a fall in the exchange rate or Price level 0 AS AS an increase in expected future inflation O B. a decrease in the money wage rate or 105 10 an increase in potential GDP ( 100 C. a decrease in expected future income or a decrease...
 The graph below depicts an economy where an increase in aggregate demand has caused inflation. The economy's current level of real GDP (Y2) is above its long-run equilibrium. This is illustrated by the long-run aggregate supply curve (LRAS) and a price level (P2) above the equilibrium value of Pe Fiscal Policy LRAS AS AD. 1 Real GDP Which of the following is an example of an automatic stabilizer that would help this economy move toward fll employment again? A reduction...
 1. Aggregate supply definitions The short-run aggregate supply curve shows: What happens to output in an economy when the government spends more money How firms respond to changes in interest rates Changes in output in an economy as the price level changes, holding all other determinants of real GDP constar The relationship between the price level and aggregate expenditure Which of the following are assumed to remain unchanged along a given short-run aggregate supply curve? Check all that The price...
 The graph below depicts the aggregate demand, Irrun aggregate supply, and short-run aggregate supply curves for the United States at an initial long-run macroeconomic equilibrium Price level] (P) LRAS SRAS Real GDP Consider a situation in which two things happen simultaneously: there is a deterioration of institutions, and the federal government massively increases spending. Which of the graphs below illustrates the shifts in this model given this situation? Price level Price level (P) (P) URAS LRAS, LRAS SRAS SRAS SRAS...
Most questions answered within 3 hours.
-
In recent years, 80% of those accused of Driving Under the
Influence (DUI) get convicted (includes...
asked 46 seconds ago -
What would the solow growth model look like if there was a
production function which had...
asked 6 minutes ago -
Why does Max Weber distinguish between "power," "authority," and
different types of authority? What is he...
asked 58 seconds ago -
A company project has an initial cost of $40,000, expected net
cash flows of $9,000 per...
asked 7 minutes ago -
How do you use strategy in your current position or how does
your current position align...
asked 9 minutes ago -
a person's ability to be properly diagnosed with a
disease/condition can be affected by the person;s...
asked 9 minutes ago -
John needs 40 Eternal Light flashlights. Each Eternal Light
flashlight requires 3 bulbs, and each bulb...
asked 17 minutes ago -
1) If Nominal GDP is $16,000 billion and the GDP deflator is 50,
then Real GDP...
asked 23 minutes ago -
D. A student completed 20 courses in the School of Arts and
Sciences. Her grades in...
asked 2 hours ago -
teo
pucks moving on a frictionless air table are about to collide. the
1.5 kg puck...
asked 2 hours ago -
Problem #1
The area between Z = 0 and Z = 2.50
The area between Z...
asked 3 hours ago -
1. What is the meaning of the term communication style?
2. What are the benefits to...
asked 3 hours ago