You are given a binary tree of the form:
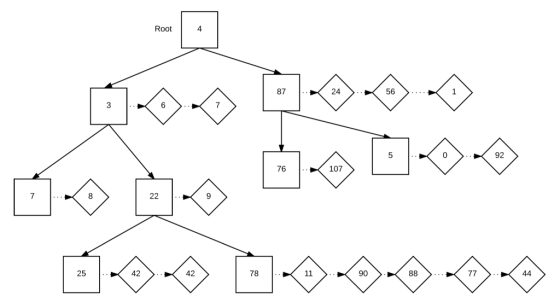
Each node in the tree has a left child and a right child. Each of the children will be extended as a linked list. Every node has the following attributes: key, left node, right node, and next node. The next node allows a node, that is a part of the tree, to be extended as a linked list. The diamonds represent the next nodes, which are part of the linked list and are not considered as a part of the tree, i. e, they are not considered as a child node or a parent node, they are simply acting as an extension to a node of the binary tree (represented by squares).
The nodes are created using the following struct:
struct node{
int key;
node* parent; // parent node of the node in question
node* left; // left node of the node in question
node* right; // right node of the node in question
node* next; // next node to form the linked list
};
The following is the algorithm to traverse the tree:
void TraverseTree(node* currentNode)
{
if(currentNode->left != NULL)
{
TraverseTree(currentNode->left);
}
printKey(currentNode->key);
if(currentNode->next != NULL)
{
TraverseLinkedList(currentNode->next);
}
if(currentNode->right != NULL)
{
TraverseTree(currentNode->right);
}
}
functions used in the algorithm:
printKey - takes the key of the current node as the argument and
prints it.
TraverseLinedList - used to traverse the Linked List and calls the
printKey function as it iterates through the linked list.
Your job is to select the correct order in which the nodes are printed when the algorithm executes on the above Binary Tree starting at the root node.
Select one:
a. 8, 7, 7, 6, 3, 42, 42, 25, 9, 22, 44, 77, 88, 90, 11, 78, 4, 107, 76, 1, 56, 24, 87, 92, 0, 5
b. 7, 8, 3, 6, 7, 25, 42, 42, 22, 9, 78, 11, 90, 88, 77, 44, 4, 76, 107, 87, 24, 56, 1, 5, 0, 92
c. 3, 6, 7, 7, 8, 22, 9, 25, 42, 42, 78, 11, 90, 88, 77, 44, 4, 87, 24, 56, 1, 76, 107, 5, 0, 92
d. 25, 42, 42, 22, 9, 78, 11, 90, 88, 77, 44, 7, 8, 3, 6, 7, 4, 76, 107, 87, 24, 56, 1, 5, 0, 92
e. 4, 3, 6, 7, 7, 8, 22, 9, 25, 42, 42, 78, 11, 90, 88, 77, 44, 87, 24, 56, 1, 76, 107, 5, 0, 92
f. 3, 6, 7, 7, 8, 25, 42, 42, 22, 9, 78, 11, 90, 88, 77, 44, 4, 87, 24, 56, 1, 76, 107, 5, 0, 92
g. 7, 8, 25, 42, 42, 78, 11, 90, 88, 77, 44, 22, 9, 3, 6, 7, 76, 107, 5, 0, 92, 87, 24, 56, 1, 4
h. 25, 42, 42, 78, 11, 90, 88, 77, 44, 7, 8, 22, 9, 76, 107, 5, 0, 92, 3, 6 ,7, 87, 24, 56, 1, 4
i. 4, 3, 6, 7, 87, 24, 56, 1, 7, 8, 22, 9, 76, 107, 5, 0, 92, 25, 42, 42, 78, 11, 90, 88, 77, 44
Homework Answers
The answer is :
g) 7, 8, 25, 42, 42, 78, 11, 90, 88, 77, 44, 22, 9, 3, 6, 7, 76, 107, 5, 0, 92, 87, 24, 56, 1, 4
Add Answer to:
You are given a binary tree of the form:
Each node in the tree has a...
Data Structure!!!!!!!!!! For the B+-tree where M=3 and L=5 shown below, show how an insert of...
Data Structure!!!!!!!!!! For the B+-tree where M=3 and L=5 shown below, show how an insert of value 77 is handled. Use the method of splitting the node rather than redistributing between siblings. || 24 || 75 || / | \ / | \ / | \ || 10 || 16 || || 41 || 50 || || 84 || 90 || | / \ / | \ | \ \ / | | | | \ | | | 2...
For the B+-tree where M=3 and L=5 shown below, show how an insert of value 77...
For the B+-tree where M=3 and L=5 shown below, show how an insert of value 77 is handled. Use the method of splitting the node rather than redistributing between siblings. || 24 || 75 || / | \ / | \ / | \ || 10 || 16 || || 41 || 50 || || 84 || 90 || | / \ / | \ | \ \ / | | | | \ | | | 2 10 16...
1. Forecast demand for Year 4. a. Explain what technique you utilized to forecast your demand....
 1. Forecast demand for Year 4.
a. Explain what technique you utilized to forecast your
demand.
b. Explain why you chose this technique over others.
Year 3 Year 1 Year 2 Actual Actual Actual Forecast Forecast Forecast Demand Demand Demand Week 1 52 57 63 55 66 77 Week 2 49 58 68 69 75 65 Week 3 47 50 58 65 80 74 Week 4 60 53 58 55 78 67 57 Week 5 49 57 64 76 77...
1. Forecast demand for Year 4.
a. Explain what technique you utilized to forecast your
demand.
b. Explain why you chose this technique over others.
Year 3 Year 1 Year 2 Actual Actual Actual Forecast Forecast Forecast Demand Demand Demand Week 1 52 57 63 55 66 77 Week 2 49 58 68 69 75 65 Week 3 47 50 58 65 80 74 Week 4 60 53 58 55 78 67 57 Week 5 49 57 64 76 77...
Suppose a binary tree data (in tiny written size) is stored in an array (A) as...
Suppose a binary tree data (in tiny written size) is stored in an array (A) as given below and root is placed at “0”index. Note the array indices are in larger written size (0 to 74). Show the traversal data of the given tree for a) In-Order Traversal b) Post Order Traversal A 0 1 2 3 4 5 6 7 8 9 10 11 12 13 14 3 28 13 36 15 9 22 44 7 10 75 33 19 15...
Consider the below matrixA, which you can copy and paste directly into Matlab.
Problem #1: Consider the below matrix A, which you can copy and paste directly into Matlab. The matrix contains 3 columns. The first column consists of Test #1 marks, the second column is Test # 2 marks, and the third column is final exam marks for a large linear algebra course. Each row represents a particular student.A = [36 45 75 81 59 73 77 73 73 65 72 78 65 55 83 73 57 78 84 31 60 83...
Please show how you did this in excel. :13-19 Every home football game for the past...
 Please show how you did this in excel.
:13-19 Every home football game for the past eight years at Eastern State University has been sold out. The revenues from ticket sales are significant, but the sale of food, beverages, and souvenirs has contrib- uted greatly to the overall profitability of the football program. One particular souvenir is the football pro- gram for each game. The number of programs sold at each game is described by the following probabil- ity distribution:...
Please show how you did this in excel.
:13-19 Every home football game for the past eight years at Eastern State University has been sold out. The revenues from ticket sales are significant, but the sale of food, beverages, and souvenirs has contrib- uted greatly to the overall profitability of the football program. One particular souvenir is the football pro- gram for each game. The number of programs sold at each game is described by the following probabil- ity distribution:...
Write a python nested for loop that prints out the following pattern 100 99 98 97...
Write a python nested for loop that prints out the following pattern 100 99 98 97 96 95 94 93 92 91 90 89 88 87 86 85 84 83 82 81 80 79 78 77 76 75 74 73 72 71 70 69 68 67 66 65 64 63 62 61 60 59 58 57 56 55 54 53 52 51 50 49 48 47 46 45 44 43 42 41 40 39 38 37 36 35 34 33...
5. Mark’s class just took the admission test for business school and averaged 87.05. Chapter 10...
5. Mark’s class just took the admission test for business school and averaged 87.05. Chapter 10 Data Set 2 contains the population of scores for the 10 other classes in Mark’s university. How did Mark’s class do? Class 1 Class 2 Class 3 Class 4 Class 5 Class 6 Class 7 Class 8 Class 9 Class 10 78 81 96 85 88 78 90 79 96 86 77 78 97 90 88 82 86 93 87 89 78 93 88...
For each variable of interest – Percent Time Asleep and Longevity – create a grouped frequency...
For each variable of interest – Percent Time Asleep and Longevity – create a grouped frequency histogram. For each histogram, use a class width of 10; use a lower limit of 0 for Percent Time Asleep and 15 for Longevity. Each histogram must include an informative title, along with correct labels for both axes. For each histogram, include a paragraph that answers each of the following questions: Is the histogram symmetric, skewed to the left, or skewed to the right?...
C# 1. Given two lengths between 0 and 9, create an rowLength by colLength matrix with...
C# 1. Given two lengths between 0 and 9, create an rowLength by colLength matrix with each element representing its column and row value, starting from 1. So the element at the first column and the first row will be 11. If either length is out of the range, simply return a null. For exmaple, if colLength = 5 and rowLength = 4, you will see: 11 12 13 14 15 21 22 23 24 25 31 32 33 34...
 1. Forecast demand for Year 4.
a. Explain what technique you utilized to forecast your
demand.
b. Explain why you chose this technique over others.
Year 3 Year 1 Year 2 Actual Actual Actual Forecast Forecast Forecast Demand Demand Demand Week 1 52 57 63 55 66 77 Week 2 49 58 68 69 75 65 Week 3 47 50 58 65 80 74 Week 4 60 53 58 55 78 67 57 Week 5 49 57 64 76 77...
1. Forecast demand for Year 4.
a. Explain what technique you utilized to forecast your
demand.
b. Explain why you chose this technique over others.
Year 3 Year 1 Year 2 Actual Actual Actual Forecast Forecast Forecast Demand Demand Demand Week 1 52 57 63 55 66 77 Week 2 49 58 68 69 75 65 Week 3 47 50 58 65 80 74 Week 4 60 53 58 55 78 67 57 Week 5 49 57 64 76 77...
 Please show how you did this in excel.
:13-19 Every home football game for the past eight years at Eastern State University has been sold out. The revenues from ticket sales are significant, but the sale of food, beverages, and souvenirs has contrib- uted greatly to the overall profitability of the football program. One particular souvenir is the football pro- gram for each game. The number of programs sold at each game is described by the following probabil- ity distribution:...
Please show how you did this in excel.
:13-19 Every home football game for the past eight years at Eastern State University has been sold out. The revenues from ticket sales are significant, but the sale of food, beverages, and souvenirs has contrib- uted greatly to the overall profitability of the football program. One particular souvenir is the football pro- gram for each game. The number of programs sold at each game is described by the following probabil- ity distribution:...
Most questions answered within 3 hours.
-
Which of the following statements are true?
1. Glass is mostly silicon dioxide and so when...
asked 17 minutes ago -
Korman Company has the following securities in its portfolio of
equity securities on December 31, 2018:...
asked 17 minutes ago -
Using the 12th edition of Language Awareness,
complete the following assignment:
After reading Akiba Solomon's "Thugs....
asked 28 minutes ago -
For all problems assume an effective monthly interest rate of 1%
unless otherwise indicated in the...
asked 39 minutes ago -
Fix all syntax and logical errors for the following program.
Please generate the correct output. //...
asked 47 minutes ago -
The USPS sells money orders identified by an 11 –digit number
x1, x2, …, x11. The...
asked 51 minutes ago -
Provide an example of equilibrium in relation to
Newton’s First and Second Laws. Explain your answer....
asked 52 minutes ago -
You are __________ to commit a Type I error using the 0.05 level
of significance than...
asked 1 hour ago -
1. the following results are obtained:
200
kiwi
575 wild-type
What can we conclude about the...
asked 1 hour ago -
Explain how you might use E. coli bacteria to produce human
growth hormone using the following:...
asked 1 hour ago -
WHAT IS THE EFFEKT OF ADD K2CO3 TO ( METHANOL OG WATER)?
asked 1 hour ago -
Calculate the cell potential, the equilibrium constant, and the
free-energy change for: Ca(s)+Mn2+(aq)(1M)⇌Ca2+(aq)(1M)+Mn(s) given
the following...
asked 1 hour ago